Solana Forms “Masterpiece” Cup and Handle Pattern as Bulls Eye $190 Breakout Target
Solana (SOL) is trading at $144, which is 4.2% more than it was 24 hours ago. Traders are paying more attention to a price structure that is
Quick overview
- Solana is currently trading at $144, showing a 4.2% increase in the last 24 hours, with analysts targeting a price range of $180 to $190.
- A classic cup and handle pattern has emerged on the daily chart, suggesting a potential breakout after three months of sideways movement.
- The derivatives market indicates strong bullish sentiment, with Solana's perpetual futures volume surpassing Ethereum's for the first time.
- Institutional interest remains high, as evidenced by significant net inflows into Solana ETFs, providing structural support amid potential liquidation risks.
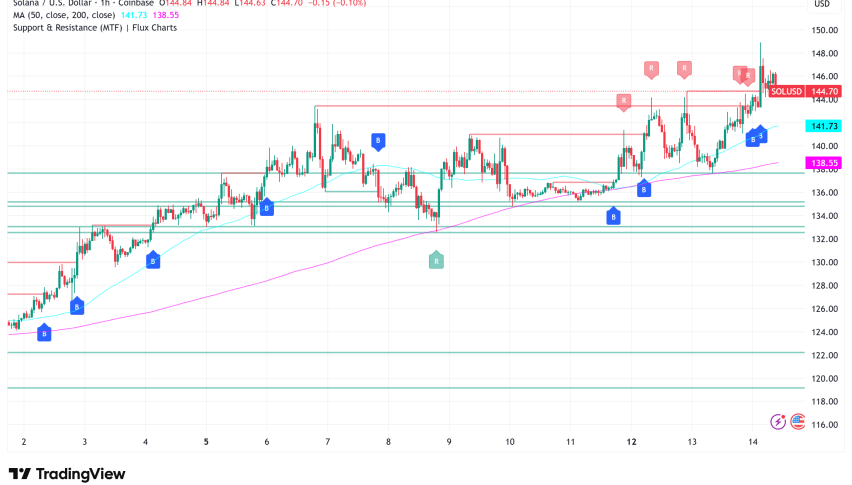
Solana SOL/USD is trading at $144, which is 4.2% more than it was 24 hours ago. Traders are paying more attention to a price structure that is getting tighter, which might mean a breakout is coming soon. After three months of sideways movement, several technical signs point to the altcoin getting ready to make a big move up. Analysts are looking at a target range between $180 and $190.
Classic Cup and Handle Pattern Emerges on Daily Chart
Since mid-November 2024, Solana has been trading in a close range of $120 to $145, making a typical cup and handle pattern on the daily chart. This continuation pattern usually shows a slow buildup followed by a controlled retreat that lowers volatility before it starts to rise again. The measured move of the pattern suggests an initial objective of about $180, which is about 25% higher than where it is now.
The $145 resistance level has been very hard to break, turning down four attempts to rally in the last three months. Technical analysts, on the other hand, think that this recurrent testing makes a breakout more likely to happen. NekoZ, a crypto trader, said the setup was “a masterpiece.” He also said that even though sentiment went pessimistic at $120, smart money seemed to be building up. NekoZ said, “Next stop: $190+.” “Don’t short a trend reversal this clean.”
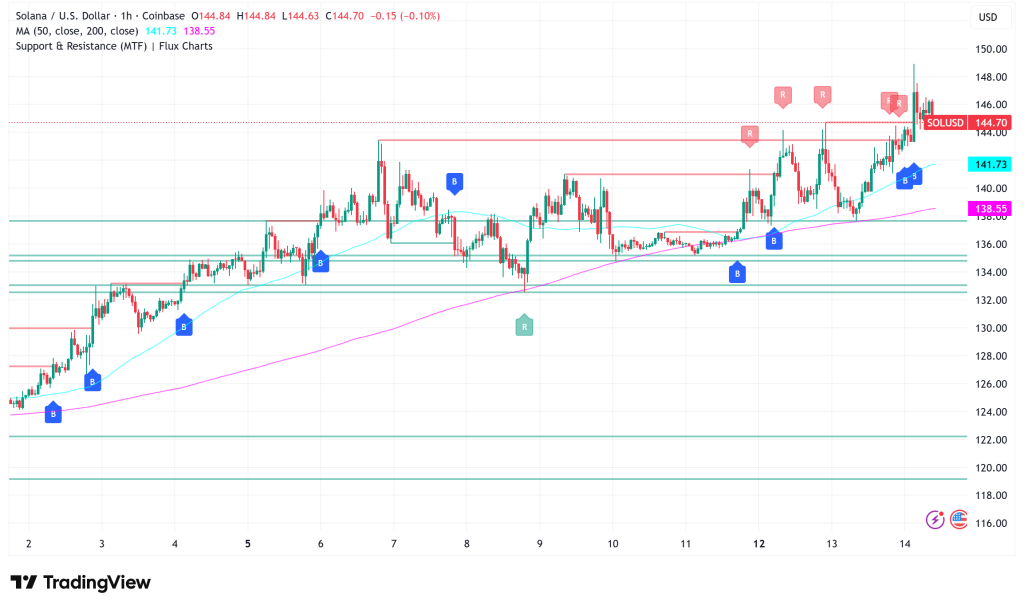
Key Moving Average Reclaimed After Four-Month Absence
SOL has rebounded and stayed above its 50-day moving average for the first time since late September 2024, which is a good sign for the bullish thesis. In the past, prolonged acceptance above this trendline has signified the conclusion of corrective phases and the start of trending markets. This suggests that sellers are losing control of the overall price structure. This technological change makes the idea that Solana may be moving from consolidation to expansion mode stronger.
SOL Derivatives Market Shows Aggressive Buyer Interest
Derivatives data shows that more and more people are being bullish, in addition to chart patterns. Solana’s 24-hour perpetual futures volume recently beat Ethereum’s, at $1.548 billion compared to Ethereum’s $1.523 billion. Ethereum has more volume over longer periods of time, with $50.86 billion in 30 days compared to Solana’s $31.61 billion. However, the short-term switch shows that traders are actively preferring SOL for leveraged exposure.
much importantly, Solana’s Open Interest has risen to $347.6 million, which is much than Ethereum’s $268.4 million. This means that more money is currently tied up in SOL derivatives, which shows that traders are becoming more confident. The 90-day Futures Taker Cumulative Volume Delta has become positive and is still climbing. This means that aggressive buyers are always stepping in, with taker purchase orders outnumbering sells. This is frequently called a “coiled spring” situation.
Open Interest has hit $8 billion, which is far higher than it was in 2024, and the OI-Weighted Funding Rate is going up. These spikes mean that fresh long positions are being opened instead of just trading in response to something. This means that constructive accumulation is happening without causing dangerous overcrowding or euphoria.
Solana ETF Inflows Provide Structural Support Amid Liquidation Risks
Spot SOL exchange-traded fund flows keep giving the market a boost. During the most recent session, US spot ETFs had $10.7 million in net inflows, with Bitwise’s BSOL leading the way with $8.6 million. Year-to-date net inflows have gone up from $1.02 billion to $1.14 billion, with no outflows recorded. This shows that institutions are still interested, which might help keep things stable during a breakout effort.
CoinGlass’s liquidation data, on the other hand, shows both risk and opportunity. Cumulative long liquidations of more over $1 billion are only $15 below current levels of about $130, which means they could be in trouble if support collapses. On the other hand, about $520 million in short liquidations are clustered around $160. If resistance breaks, this might speed up the upward trend. The larger liquidity concentration at $130 means that a little fall is still feasible before a long-term rebound.
Solana Price Prediction: Path to $190 Depends on Breakout Confirmation
Traders will need to see a confirmed daily closing above $145 resistance with solid volume for Solana to reach the $180–$190 target zone. If the measured move from the cup and handle pattern happens, along with limited liquidity above resistance and increased demand for derivatives, it may quickly push SOL toward $160, where short liquidations could give it further more power.
The setup is still good, but it’s not a sure thing. If it doesn’t breach $145, it could go back down to $130 support, where a lot of long liquidations are waiting. The 50-day moving average is providing dynamic support, there are steady inflows into ETFs, and futures positioning is supporting bulls, so the technical groundwork seems good for a prolonged breakout effort in the next few weeks.
- Check out our free forex signals
- Follow the top economic events on FX Leaders economic calendar
- Trade better, discover more Forex Trading Strategies
- Open a FREE Trading Account
- Read our latest reviews on: Avatrade, Exness, HFM and XM
Related Articles

Sidebar rates
Related Posts
