AUD/USD Slides Below $0.6680 as $0.6700 Fails Despite China Trade Boost
AUD/USD is trading near $0.6678, extending its pullback after failing to sustain gains above the $0.6720–$0.6730 resistance zone...
Quick overview
- AUD/USD is currently trading around $0.6678, continuing its pullback after failing to maintain gains above the $0.6720–$0.6730 resistance zone.
- Despite supportive macro factors for the Australian dollar, including strong Chinese trade data and resilient domestic indicators, traders remain cautious ahead of US Retail Sales data.
- Technical analysis shows AUD/USD has fallen below key moving averages, indicating short-term bearish pressure, with key support levels at $0.6663 and $0.6639.
- A suggested trading strategy is to sell rallies below $0.6700, with a stop above $0.6725 and a target range of $0.6663–$0.6640.
AUD/USD is trading near $0.6678, extending its pullback after failing to sustain gains above the $0.6720–$0.6730 resistance zone. The move has surprised some traders. On paper, the macro backdrop remains broadly supportive for the Australian dollar, with stronger Chinese trade data, resilient domestic indicators, and a softer US inflation profile. Yet price action tells a more cautious story.
Market positioning appears restrained ahead of US Retail Sales, expected to rise 0.4% in November, led by stronger vehicle demand. With a key US data release looming, traders have been reluctant to chase AUD strength, keeping near-term upside capped.
Australia and China Data Stay Firm
Fundamentals out of Australia remain constructive. Building Permits jumped 15.2% in November, reaching a near four-year high and reinforcing expectations that housing activity is stabilizing. This has kept speculation alive that the Reserve Bank of Australia may retain a hawkish bias for longer than peers.
China also delivered supportive signals. December trade data showed a CNY 808.8 bn surplus, with exports up 6.6% and imports rising 5.7% in USD terms. Historically, stronger Chinese trade flows tend to benefit the Australian dollar, given Australia’s export exposure. Despite this, AUD/USD has struggled to attract sustained buying interest.
Soft US Inflation Fails to Lift AUD/USD
On the US side, inflation data leaned dovish. Core CPI rose just 0.2% month over month, keeping annual core inflation at 2.6%, the lowest level in four years. Headline CPI matched expectations at 0.3% monthly. While this has reinforced expectations for eventual Federal Reserve rate cuts, the US dollar has not weakened enough to drive a clean AUD/USD rebound.
This disconnect highlights how near-term price action is being driven more by positioning and technical levels than by fundamentals alone.
AUD/USD Technical Picture Turns Defensive
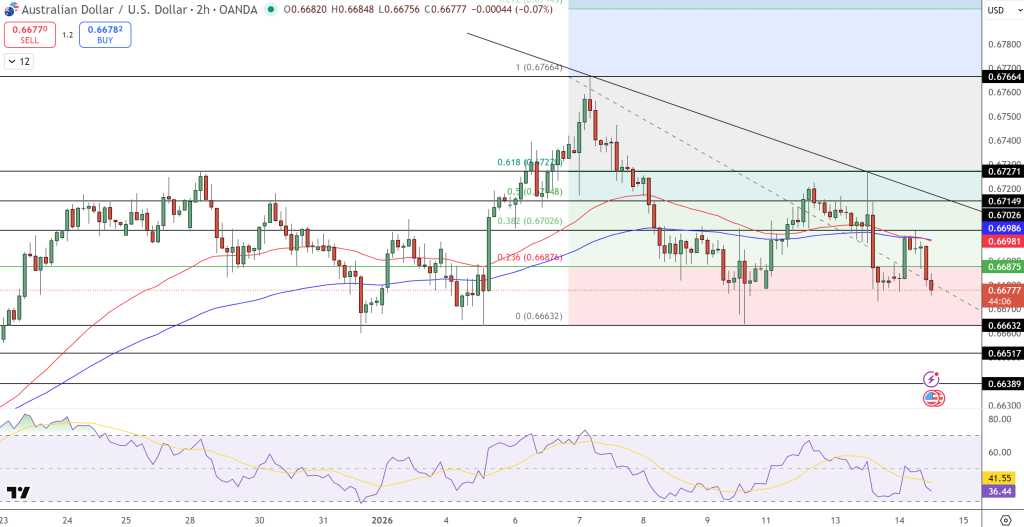
From a technical standpoint, AUD/USD has slipped back below both the 50-EMA and 200-EMA, signaling short-term bearish pressure. A descending trendline from early January continues to cap rallies. The latest pullback has retraced through the 38.2% ($0.6703) and 23.6% ($0.6688) Fibonacci levels.
Key levels to watch include:
- Support: $0.6663, then $0.6639
- Resistance: $0.6700, followed by $0.6725
RSI is hovering near 36–40, reflecting weak momentum without clear bullish divergence.
Trade idea: Sell rallies below $0.6700, stop above $0.6725, target $0.6663–$0.6640.
- Check out our free forex signals
- Follow the top economic events on FX Leaders economic calendar
- Trade better, discover more Forex Trading Strategies
- Open a FREE Trading Account
- Read our latest reviews on: Avatrade, Exness, HFM and XM
Related Articles


Sidebar rates
Related Posts
