btc-usd
Forex Signals Jan 19: Earnings in Spotlight – Intel, Netflix, J&J, GE Aerospace and P&G Report Today
Investors will receive fresh data on consumer demand, healthcare trends, and industrial advancements from a number of major U.S. businesses,
•
Last updated: Monday, January 19, 2026

Quick overview
- Major U.S. companies, including Intel and Netflix, are set to report earnings, providing insights into consumer demand and market trends.
- Market activity has slowed ahead of a long holiday weekend, with investors showing caution and trading volumes remaining thin.
- Large-cap stocks experienced modest declines due to valuation sensitivity, while small-cap stocks like the Russell 2000 outperformed, indicating capital rotation within the market.
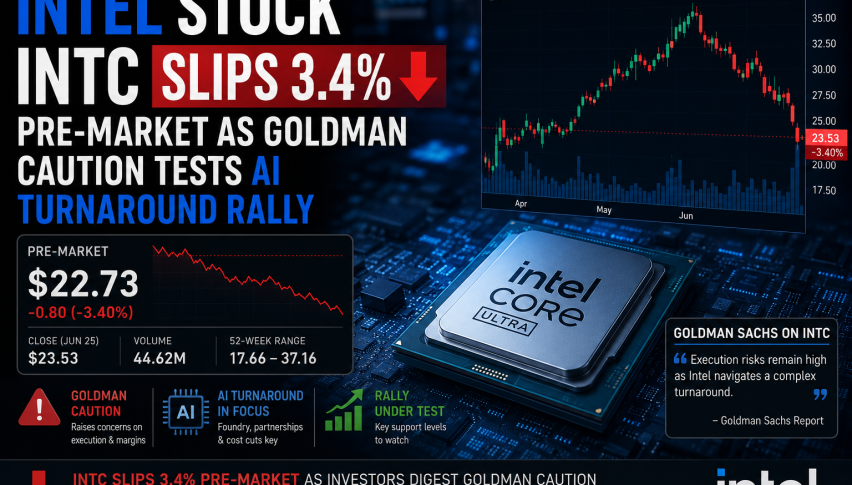
- Intel's upcoming earnings are anticipated to reflect ongoing challenges, with a significant year-over-year decline in earnings expected amid mixed segment performance.
Live BTC/USD Chart
BTC/USD

0.0000
MARKETS TREND
Investors will receive fresh data on consumer demand, healthcare trends, and industrial advancements from a number of major U.S. businesses, including Intel, Netflix, J&J, GE Aerospace, and P&G.
Holiday-Thinned Trading Sets a Cautious Backdrop
Market activity slowed noticeably on Friday as investors positioned ahead of a long U.S. holiday weekend. With Wall Street closed on Monday, trading volumes remain thin. Although the news cycle remained active—including final remarks from Federal Reserve officials before the policy blackout period—there was little urgency from market participants to react.
Currency markets reflected the same cautious tone, ending the session largely unchanged as traders opted to reduce activity and wait for clearer signals after the holiday.
Large-Cap Stocks Ease on Valuation Discipline
U.S. equity benchmarks finished modestly lower, with the Dow Jones Industrial Average, S&P 500, and Nasdaq all posting small declines. The pullback appeared driven more by valuation sensitivity than by a shift toward risk aversion.
After a strong start to 2026, investors showed restraint toward elevated large-cap valuations, choosing to trim exposure or pause positioning rather than extend gains in thin market conditions. The session reflected consolidation rather than a broader change in trend.
Small Caps Outperform as Capital Rotates
In contrast to the softness in mega-cap stocks, the Russell 2000 posted a notable gain, highlighting selective risk-taking beneath the surface. The divergence suggests that capital is rotating within the equity market rather than exiting altogether.
Investors appear increasingly willing to look beyond crowded large-cap trades in search of relative value, reinforcing the idea of internal reallocation rather than broad-based de-risking.
Key Market Events to Watch This Week:
Intel Earnings Preview: Slowing Growth, Mixed Segment Signals
Earnings and Revenue Expectations
Against this cautious market backdrop, attention is turning to Intel’s upcoming earnings release. Wall Street analysts expect Intel (INTC) to report earnings of $0.08 per share, representing a 38.5% decline year over year. Revenue is forecast at $13.37 billion, down 6.2% from the same quarter last year.
The estimates reflect ongoing pressure from margin compression, competitive dynamics in semiconductors, and the company’s continued investment cycle.
Product Group Performance: Diverging Trends
Intel’s segment breakdown highlights a mixed earnings picture:
Data Center and AI (Intel Products Group)
Analysts expect revenue of $4.36 billion, representing a 28.8% year-over-year increase.
This segment remains a key bright spot, reflecting improving demand tied to AI workloads and enterprise infrastructure spending.
Client Computing Group (CCG)
Revenue is forecast at $8.33 billion, up 4% year over year.
Modest growth suggests stabilization in PC demand, though recovery remains uneven.
Total Intel Products Group
Combined revenue is estimated at $12.68 billion, a 2.7% decline year over year, highlighting that strength in AI is not yet enough to offset broader product pressure.
Foundry and Other Businesses Remain a Headwind
Intel Foundry Services (IFS)
Revenue is expected to reach $4.39 billion, down 2.4% year over year.
While strategic investments continue, near-term returns remain limited, and the foundry business continues to weigh on consolidated performance.
All Other Revenue
Analysts project $750.12 million, reflecting a 28% year-over-year decline, underscoring softness in non-core and legacy segments.
What Markets Will Be Watching
Beyond headline earnings, investors will focus on:
- Margin trends amid heavy capital spending
- Commentary on AI competitiveness and roadmap execution
- Progress on foundry customer onboarding
- Management guidance for the remainder of 2026
Given the muted broader market environment, Intel’s forward-looking commentary may have a greater influence on share price than the earnings figures themselves.
More Earnings to Watch This Week
Netflix (NFLX)
- Quarter: Q4 2025
- Earnings Timing: After Market Close (AMC)
- Expected EPS: $0.55
Johnson & Johnson (JNJ)
- Quarter: Q4 2025
- Earnings Timing: Before Market Open (BMO)
- Expected EPS: $2.47
GE Aerospace (GE)
- Quarter: Q4 2025
- Earnings Timing: Before Market Open (BMO)
- Expected EPS: $1.43
Procter & Gamble (PG)
- Quarter: Q2 2026
- Earnings Timing: Before Market Open (BMO)
- Expected EPS: $1.86
Gold Pushes Toward $5,000
Although demand for safe haven assets is still high, gold fell precipitously from record highs following the Fed’s most recent rate cut comments, as profit-taking was prompted by Powell’s cautious tone. In December, gold jumped above $4.3800 following the Federal Reserve’s announcement of a 25 basis point rate decrease. But the impetus soon waned, and prices dropped back to $4,004. The 20 daily SMA (gray) held as support last week and buyers returned and pushed XAU above $4,600K.
USD/JPY Nears 160
Foreign exchange markets saw sharp swings. Early in the week, U.S. yield differentials and Japanese capital outflows pushed the dollar above ¥150, but disappointing U.S. jobs data triggered profit-taking, causing the USD/JPY to slide by four yen from its peak. However, the new BOJ governor the JPY has weakened and USD/JPY soared to 154 and we decided to close our buy signal for more than 80 pips as the pair found support at the 20 daily SMA (gray) and has rebounded more than 200 pips off that MA but reversed after the 25 bps rate cut from the FED.
USD/JPY – Daily Chart
Cryptocurrency Update
Bitcoin Approaches $100K
Cryptocurrencies remained highly active over the summer. Bitcoin (BTC) climbed to fresh highs of $123,000 and $124,000 in July and August, supported by institutional inflows and technical strength. However, remarks from Treasury Secretary Scott Bessent ruling out U.S. increases to BTC reserves triggered a steep pullback, sending the coin down to $80K before finding support at the 100 weekly SMA (green). A rebound has followed this week, sending BTC near $100 which will be the first major text for Bitcoin buyers.
BTC/USD – Weekly Chart
Ethereum Pushing Above the 100 Weekly SMA
Ethereum (ETH) has been similarly strong, surging toward $4,800, its highest since 2021 and near its all-time peak of $4,860. Despite a dip last week, ETH found support at the 20-day SMA, with retail enthusiasm and renewed institutional participation driving fresh upside momentum. Last week we saw a dive below $2.700 but the 200 weekly SMA held as support and we’re seeing a rebound but buyers face the 100 SMA (green) now.
ETH/USD – Weekly Chart
- Check out our free forex signals
- Follow the top economic events on FX Leaders economic calendar
- Trade better, discover more Forex Trading Strategies
- Open a FREE Trading Account
- Read our latest reviews on: Avatrade, Exness, HFM and XM
ABOUT THE AUTHOR
See More
Skerdian Meta
Lead Analyst
Skerdian Meta Lead Analyst.
Skerdian is a professional Forex trader and a market analyst. He has been actively engaged in market analysis for the past 11 years. Before becoming our head analyst, Skerdian served as a trader and market analyst in Saxo Bank's local branch, Aksioner. Skerdian specialized in experimenting with developing models and hands-on trading. Skerdian has a masters degree in finance and investment.
Related Articles


Sidebar rates
Related Posts
