Silver (XAG/USD) Technical Analysis: Navigating the $82 Support Level
On February 2, 2026, the silver spot price became highly volatile and is now trading around $82.13. This comes after a sharp drop...
Quick overview
- On February 2, 2026, the silver spot price is highly volatile, trading around $82.13 after a drop from an all-time high of $121.88.
- The 4-hour chart indicates a break in the parabolic trend, with several large red candles suggesting bearish momentum.
- Key Fibonacci levels show immediate resistance at $83.10 and strong support at $79.00, with deeper support at $71.23.
- Technical indicators reveal the RSI is in oversold territory at 29, indicating potential for a short-term bounce despite strong bearish momentum.
On February 2, 2026, the silver spot price became highly volatile and is now trading around $82.13. This comes after a sharp drop from the recent all-time high of $121.88, marking a quick correction in the precious metals market.
Chart Patterns & Candlestick Analysis
The 4-hour chart shows a clear break in the parabolic trend. After a sharp surge, silver has formed several large red candles in a row, falling through several moving averages.
- The steep upward trendline from January’s rally has clearly failed. Now, the price is trying to find support in a new, quickly forming downward channel.
- Recent candles have long upper wicks, which shows that buyers trying to buy the dip are quickly being outnumbered by sellers closing their positions.
Fibonacci & Key Levels
Using the Fibonacci Retracement tool from the recent low to the $121.88 high points out these key areas:
- 0.236 Retracement ($83.10): This level is currently acting as immediate overhead resistance. A failure to reclaim this suggests further downside.
- Support Zones: Strong horizontal support is noted at $79.00, followed by a deeper structural floor at $71.23.
- Resistance: Beyond the Fibonacci levels, the former support at $90.46 and $96.40 now serve as heavy resistance ceilings.
Silver (XAG/USD) Technical Indicators
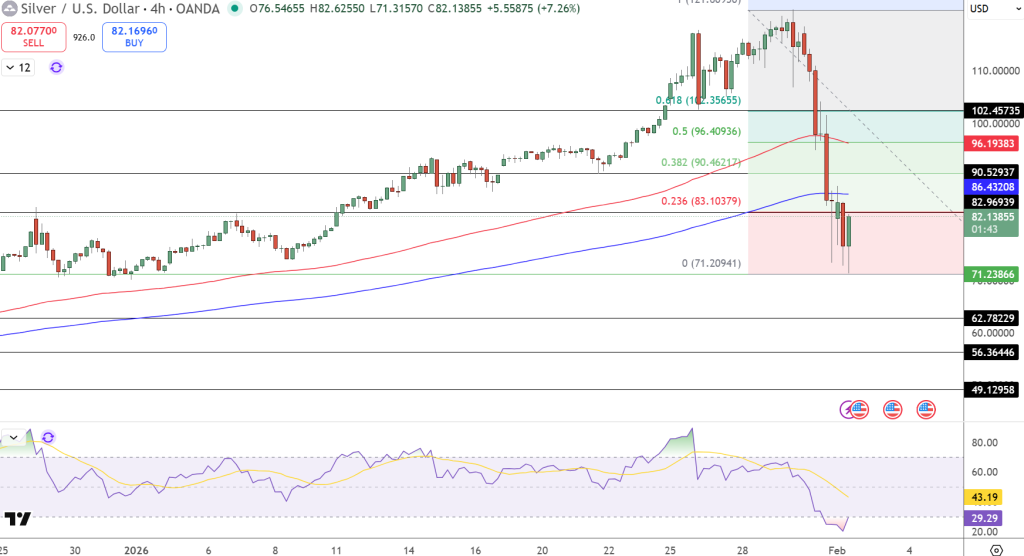
The RSI has dropped into deep oversold territory and is now around 29. This often comes before a short-term bounce, but the sharp decline shows that bearish momentum is still strong.
The price is now below both the 50-EMA ($96.19) and the 200-SMA ($82.96), which confirms that the medium-term trend has turned bearish.
Trade idea: Consider selling if the price rallies to $83.50, aiming for a target of $71.25 and using a tight stop-loss above $90.50.
- Check out our free forex signals
- Follow the top economic events on FX Leaders economic calendar
- Trade better, discover more Forex Trading Strategies
- Open a FREE Trading Account
- Read our latest reviews on: Avatrade, Exness, HFM and XM
Related Articles
Sidebar rates
Related Posts
