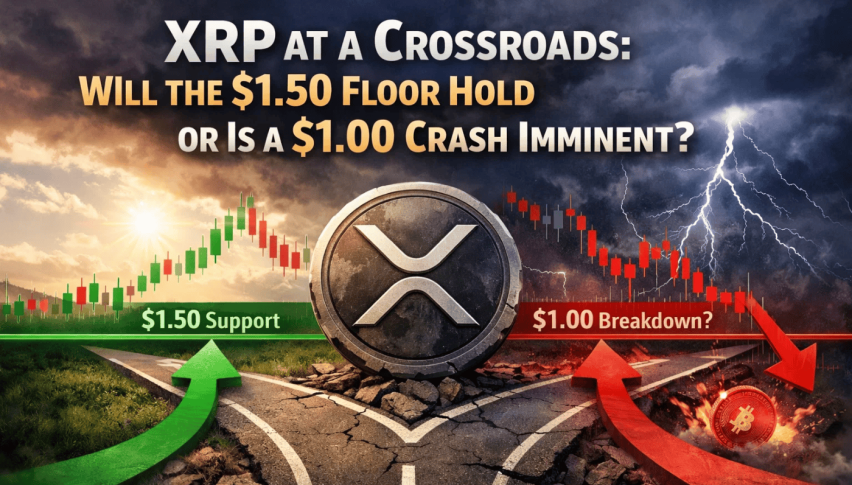
XRP at a Crossroads: Will the $1.50 Floor Hold or Is a $1.00 Crash Imminent?
Ripple’s token, XRP, dropped to nine-month lows near $1.59 in early February 2026 as a bearish chart pattern broke down.
Quick overview
- XRP's price fell to approximately $1.59 on February 2, 2026, marking a significant drop from January's highs and confirming a breakdown from a long-term descending triangle.
- The release of 1 billion XRP tokens on February 1 added liquidity to the market, contributing to the ongoing bearish trend despite a majority being re-locked.
- Despite the price decline, XRP Ledger transactions reached 1.9 million daily, indicating resilience in network activity amid market turmoil.
- The Fear & Greed Index for XRP has dropped to 14, reflecting extreme fear and broader underperformance compared to Bitcoin.
Ripple’s token, XRP, dropped to nine-month lows near $1.59 in early February 2026 as a bearish chart pattern broke down. This article looks at how Ripple’s billion-token escrow unlock and recent high-volume liquidations are affecting the XRP Ledger.
The XRP token plummeted more than 5% in a 24-hour window on February 1–2, 2026, marking a sharp rejection from the $1.80 psychological floor. This article examines the convergence of technical breakdowns and fundamental supply shocks, specifically the routine but high-impact monthly escrow release, which has left XRP struggling to maintain its footing above $1.50. The current sell-off underscores how structural technical patterns can override long-term utility narratives during periods of extreme market fear.
Key Takeaways
- Price Collapse: XRP hit approximately $1.59 on February 2, 2026, a significant drop from January peaks above $2.00, confirming a breakdown from a long-term descending triangle.
- Escrow Pressure: Ripple unlocked 1 billion XRP on February 1, 2026. While roughly 800 million were re-locked, the net supply increase added liquidity into a “risk-off” market environment.
- Network Resilience: Despite price weakness, XRPL daily transactions hit 1.9 million, and Real-World Asset (RWA) TVL on the ledger reached a record $235 million.
- Sentiment Shift: The Fear & Greed Index for XRP has plunged to 14 (Extreme Fear), reflecting broader altcoin underperformance against Bitcoin.
XRP’s Spectacular Breakdown Amid the Market Turmoil
As the wider crypto market lost $220 billion in value, XRP also saw a major technical change. In early February 2026, its price fell below the $1.81 support, which had held since late 2025. The price dropped to $1.5290 before settling near $1.59, causing many leveraged traders to be liquidated.
This crash shows a widening gap between XRP’s real-world use and its market price. Even though Ripple got new regulatory approvals in Dubai and Singapore this year, the price is still stuck in a bearish trend that has blocked any recovery since mid-2025.
What Caused the Wipeout in XRP Price: Top 4 Reasons
The primary catalyst for XRP’s recent decline was the technical resolution of a months-long consolidation phase. However, secondary fundamental factors amplified the volatility:
- Descending Triangle Resolution: The price breached the horizontal floor at $1.81. In technical analysis, this breakdown often leads to a “measured move” downside, targeting the next liquidity pools near $1.28.
- Monthly Escrow Inflation: The release of 1 billion tokens on February 1 reminded the market of the ongoing supply expansion. Even with the standard re-locking of most tokens, the optics during a bearish week triggered pre-emptive selling.
- ETF Outflows: After a period of institutional hype, spot XRP ETFs saw a net outflow of $41 million in late January, suggesting that “smart money” is temporarily rotating into safer yields or gold.
- Death Cross Positioning: The price has remained stuck below the 200-day SMA ($2.35) and 100-day EMA ($2.22), creating a heavy “ceiling” that discourages new buyers from entering until a trend reversal is confirmed.
XRP Price Forecast: Why the Downtrend Still Matters Near $1.60
Looking at the charts, XRP/USD shows signs of a continued downtrend. The Relative Strength Index (RSI) is dropping toward 35, which means the asset is getting close to being oversold, but sellers still have the upper hand.
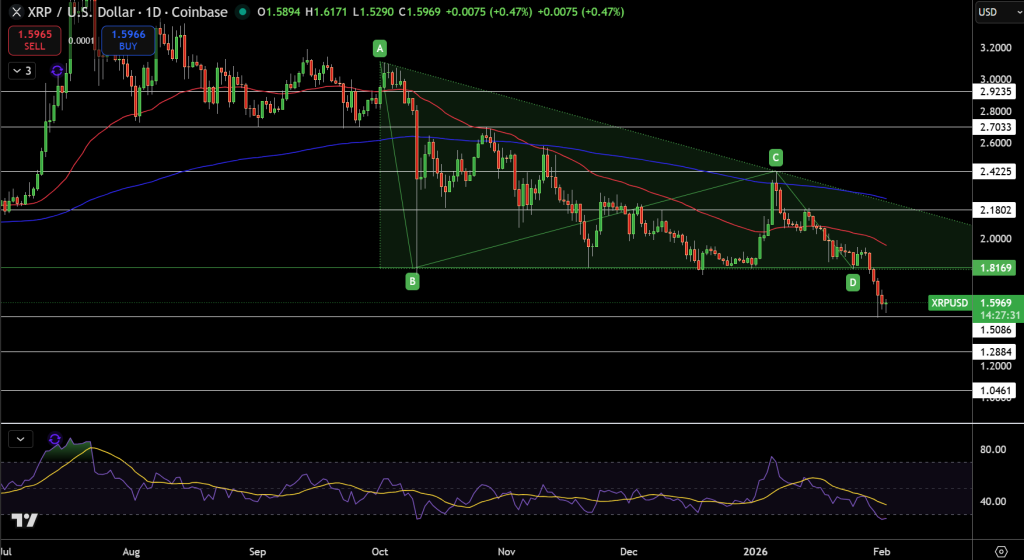
XRP is now trading in a narrow range between $1.55 and $1.65. The price shows strong selling at both the start and end of each session.
- Support: The nearest support is at $1.50, with a stronger level at $1.28.
- Resistance: Any bounce will likely meet selling at $1.71 and again at $1.81, which is now resistance.
- Indicator Check: The MACD histogram is still negative, but if XRP stays above $1.50 this week, there are early signs of a possible hidden bullish divergence.
Trade Idea: You might consider a short position if XRP bounces to $1.70, aiming for a target of $1.30 and setting a stop-loss above $1.85.
Bottom Line: Utility Growth vs. Technical Gravity
The early February 2026 drop in XRP shows that real-world adoption, such as the Ripple Treasury launch, often takes time to affect prices. Even though XRPL activity is high, the fading $3.00 price target has made XRP a high-volatility sentiment play. Investors should watch escrow re-locks and ETF flows to see if $1.60 is a long-term buying opportunity or just a stop before another drop to $1.00.
- Check out our free forex signals
- Follow the top economic events on FX Leaders economic calendar
- Trade better, discover more Forex Trading Strategies
- Open a FREE Trading Account
- Read our latest reviews on: Avatrade, Exness, HFM and XM
Related Articles


Sidebar rates
Related Posts
