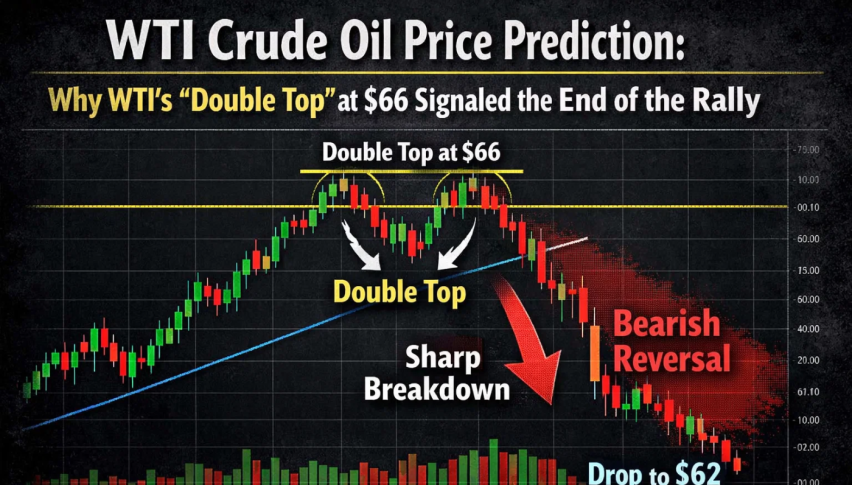
WTI Crude Oil Price Prediction: Why WTI’s “Double Top” at $66 Signaled the End of the Rally
WTI Crude Oil (USOR) faced a violent reversal in early February 2026, plunging over 5% to trade near $62.25 after multi-month highs.
Quick overview
- WTI Crude Oil experienced a sharp 5% drop to around $62.25 after reaching multi-month highs, driven by a shift in US-Iran diplomatic relations.
- The market correction was exacerbated by OPEC+'s decision to maintain output quotas, failing to counteract the geopolitical de-escalation.
- Technical indicators reveal a bearish 'double top' pattern, with critical support levels now at $61.50 and $60.00.
- Analysts predict a global supply surplus of up to 3.5 million barrels per day in 2026, suggesting that recent price rallies were unsustainable.
WTI Crude Oil (USOR) faced a violent reversal in early February 2026, plunging over 5% to trade near $62.25 after multi-month highs. This analysis deconstructs the sudden “diplomatic pivot” that erased January’s geopolitical risk premium and examines the key Fibonacci floors now under fire.
The WTI Crude market underwent a significant correction on February 1–2, 2026, retreating from its $66.60 resistance peak as emerging US-Iran negotiations deflated the “war premium”. This article explores how a shift from military threats to serious diplomatic signaling—coupled with an OPEC+ decision to keep output frozen—has sent traders rushing to liquidate long positions. The sharp downturn marks an abrupt halt to crude’s six-week winning streak, exposing the market to its underlying structural surplus.
Key Takeaways
- Sharp Correction: WTI Crude (March ’26) fell to approximately $62.25, a 5.3% single-day drop after testing a two-year resistance at $66.
- Diplomatic Catalyst: President Trump’s weekend remarks on “serious talks” with Iran signaled a cooling of tensions, removing the primary driver of January’s 6.8% rally.
- Technical Breakdown: Price action has breached the $63.50 support, confirming a bearish “double top” pattern on short-term charts.
- Fundamental Headwinds: OPEC+ confirmed it would maintain March output quotas, while analysts warn of a global surplus reaching up to 3.5 million barrels per day this year.
WTI’s 5% Plunge Amid Diplomatic De-escalation
While the market began 2026 on a “war footing,” February has brought a dramatic pivot in sentiment. In a 24-hour window, WTI futures shed over $3.23, retreating from multi-month highs as reports indicated that Iranian naval forces had no immediate plans for live-fire exercises in the Strait of Hormuz.
This sell-off highlights the fragility of price rallies built purely on geopolitical risk rather than structural demand. With the US Dollar Index (DXY) reclaiming the 97 level, the stronger greenback has added further mechanical pressure to dollar-denominated oil prices.
What Caused the Wipeout in Crude Prices: Top 4 Reasons
The primary driver of the February 2026 collapse was the sudden evaporation of the geopolitical risk premium:
- US-Iran Diplomacy: Weekend signals from both Washington and Tehran regarding formal negotiations defused the threat of strikes on Iranian oil infrastructure.
- OPEC+ Production Freeze: The group’s decision to keep output unchanged in March—the end of a three-month freeze—failed to provide a bullish surprise to offset the geopolitical cooling.
- Global Supply Surplus: Despite a recent 2.3-million-barrel drop in US inventories, analysts remain focused on a massive projected global surplus for 2026, which continues to cap medium-term upside.
- Technical “Double Top”: Analysts noted the failure at the $66.60 resistance and the subsequent break of the $63.50 neckline, which triggered automated selling toward lower support zones.
Crude Oil Price Forecast: Can the $61.50 Floor Hold?
From a technical standpoint, the 4-hour WTI chart on TradingView shows the price falling out of its ascending channel. The Relative Strength Index (RSI) has dropped from overbought territory toward 45, suggesting that while the immediate “blow-off” is over, momentum remains bearish.
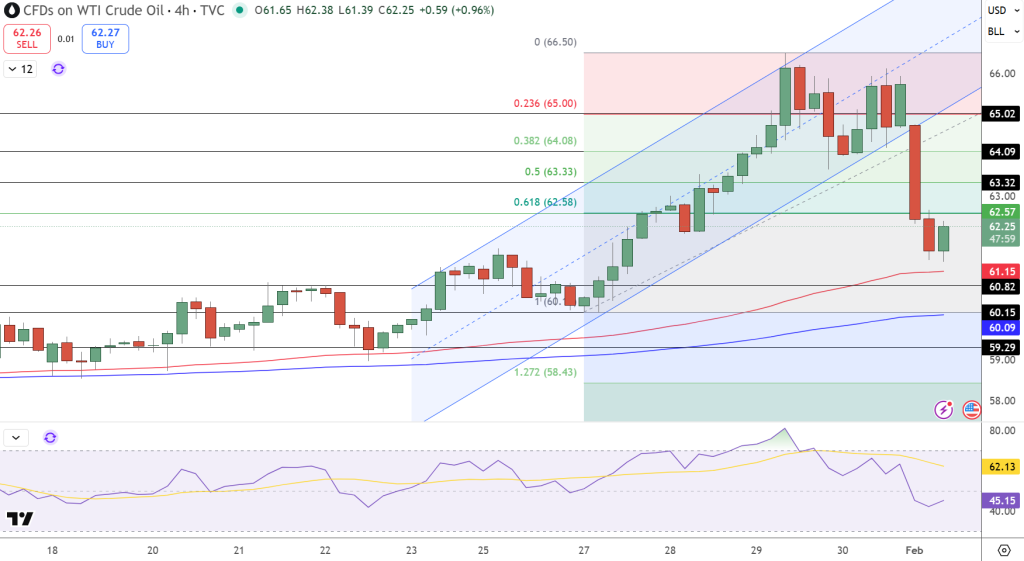
- Key Support: The next critical floor is at $61.50, followed by psychological support at $60.00. A breach below $60.00 would re-expose the $58.50 level.
- Resistance: Immediate overhead resistance is now firmly at $63.50 (the broken neckline) and the recent pivot at $65.02.
- 2026 Outlook: A Reuters poll of analysts predicts WTI will average $58.72 in 2026, suggesting the recent rally above $60 was an anomaly that is now being corrected.
Trade Idea: Sell on a relief bounce toward $63.27, targeting the $59.47 zone, with a stop-loss placed above the recent swing high at $65.48.
Bottom Line: The “War Premium” Meets Reality
The early February 2026 slide in WTI Crude (USOR) serves as a reminder that geopolitical premiums are often ephemeral. While individual events like the Venezuela crisis or Iran tensions can trigger volatility, the 2026 market remains characterized by weak demand growth and a persistent supply overhang. Investors should view the current correction as a realignment with fundamental reality, prioritizing risk management as crude settles back toward its consensus range of $58–$62.
- Check out our free forex signals
- Follow the top economic events on FX Leaders economic calendar
- Trade better, discover more Forex Trading Strategies
- Open a FREE Trading Account
- Read our latest reviews on: Avatrade, Exness, HFM and XM
Related Articles

Sidebar rates
Related Posts
