Silver Price Forecast: “Gold’s Volatile Cousin” Fights for a Floor Above $81
Silver Spot (XAG/USD) has dropped 37% from its record highs after margin increases and signals from the Fed led to a liquidity crunch.
Quick overview
- Silver Spot (XAG/USD) has experienced a 37% drop from its record high due to margin increases and a liquidity crunch.
- The price fell sharply from $121.78 to an intraday low of $71.20, marking its largest one-day drop in over forty years.
- Technical analysis indicates immediate support at $83.10, with potential resistance around $90.46 and $96.19.
- Despite short-term volatility, long-term demand from industries like solar and EVs may support silver prices.
Silver Spot (XAG/USD) has dropped 37% from its record highs after margin increases and signals from the Fed led to a liquidity crunch. This report looks at key support levels and explains why industrial demand in 2026 could support long-term growth.
On February 3, 2026, Silver Spot (XAG/USD) entered a sharp correction after hitting a record high of $122. The price is now around $83.16, showing that a major sell-off wiped out months of gains in only three days.
The sell-off got worse as the U.S. Dollar strengthened and high-leverage traders quickly exited the market after Kevin Warsh was nominated as the next Fed Chair.
Key Takeaways: The 37% Liquidation Event
- Historic Price Crash: Silver fell from a high of $121.78 to an intraday low of about $71.20 on February 2, marking its largest one-day drop in more than forty years.
- Margin Pressure: The CME Group raised initial margin requirements for silver futures to 15%, which led to a series of forced liquidations among traders with too much leverage.
- Industrial Fatigue: When silver reached $120, large industrial buyers in the solar and EV sectors, who account for more than half of yearly demand, reportedly stopped buying, which caused physical premiums to drop sharply.
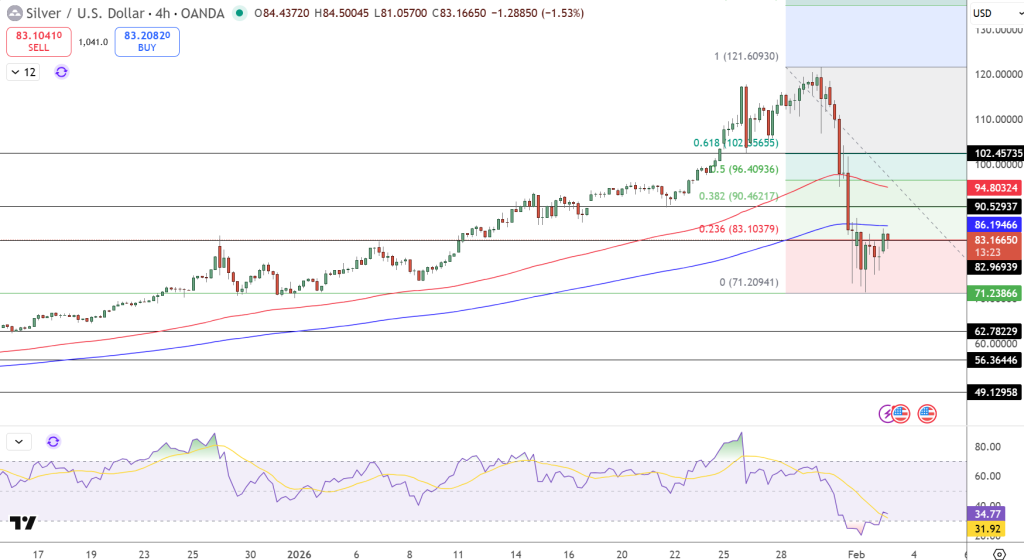
Silver (XAG/USD) Technical Analysis: The Anatomy of a Reversal
The 4-hour XAG/USD chart shows a sharp peak followed by a steep drop, with the price falling below several moving averages.
- Fibonacci Retracement: The price is now testing the 0.236 Fibonacci level at $83.10. If it does not stay above this level, the next support is at $79.00.
- Immediate Support: If the current support fails, the next key level is $71.20, which is the ‘0’ Fibonacci level.
- Resistance Ceiling: Any rebound will likely meet resistance at $90.46 (the 0.382 Fibonacci level) and again near the previous support at $96.19.
- Momentum Indicators: The RSI (Relative Strength Index) has dropped to a deeply oversold level near 29.29. This shows that selling is intense, but the trend will likely stay negative until a clear bottom forms.
The 2026 Outlook: Narrative Decay or Structural Deficit?
Even with the recent market turmoil, the long-term case for higher silver prices is still linked to the global shift toward green energy. In the short term, though, technical factors are driving the market.
- Safe-Haven Resilience: The move away from the U.S. Dollar supports precious metals, but silver is more volatile than gold and is more likely to experience sharp drops when liquidity is low.
- Speculative Reset: Analysts see this crash as a needed correction to remove the excessive optimism that pushed prices far above their industrial value.
Trade Idea: Look for a possible short-term rebound near the $81.00 to $82.00 support area. If the price rises toward $90.00 but stays below $96.00, consider selling with a target of $71.25.
Bottom Line: Silver is in a period of high volatility and correction. Long-term demand from industries like solar, EVs, and AI still supports the market, but short-term moves are driven by changing stories and forced selling. It is best to be cautious until the price moves back above $83.00 with strong trading volume.
- Check out our free forex signals
- Follow the top economic events on FX Leaders economic calendar
- Trade better, discover more Forex Trading Strategies
- Open a FREE Trading Account
- Read our latest reviews on: Avatrade, Exness, HFM and XM
Related Articles


Sidebar rates
Related Posts
