Weekly Gold Price Forecast: Will XAU/USD Reclaim $5,100 or Sink to New Lows?
Gold starts the week of February 9, 2026, in a tense period of consolidation. Earlier this month, prices dropped sharply...
Quick overview
- Gold prices have stabilized at $4,968 per ounce after a significant drop from $5,600 to $4,400 earlier this month.
- The nomination of Kevin Warsh as the next Federal Reserve Chair has contributed to a stronger US Dollar and higher Treasury yields, impacting gold's value.
- Despite recent volatility, gold remains a safe investment due to rising geopolitical tensions and tariffs, with emerging markets continuing to buy on dips.
- Technical analysis suggests a potential recovery if gold can break above the $5,100 resistance level, while careful risk management is advised.
Gold starts the week of February 9, 2026, in a tense period of consolidation. Earlier this month, prices dropped sharply from a record $5,600 to a low near $4,400, but have now settled at $4,968 per ounce.
When markets reopen tomorrow, attention will move from selling to a contest between short-term sellers and long-term buyers. With the Chinese Lunar New Year on February 16 and a more aggressive Federal Reserve, high volatility is very likely.
The “Warsh” Effect: A New Era for the Fed?
The main reason for the recent $1,200 price swing is the nomination of Kevin Warsh as the next Federal Reserve Chair.
- Many see Warsh as someone who is tough on inflation and prefers a smaller Fed balance sheet. This has strengthened the US Dollar and pushed Treasury yields higher, making it harder for gold to gain value.
- The news about Warsh led to widespread selling. Investors sold gold to cover losses in stocks and silver, which fell 36% in just one week.
Geopolitics & Tariffs: The Unbreakable Floor
Even after the sharp drop, gold is still seen as a safe investment because of rising trade and physical conflicts.
- President Trump’s threat of 100% tariffs on Canada and new tariffs on South Korea and Europe has led more investors to move money into gold for safety.
- Emerging markets and the National Bank of Poland are still buying gold when prices fall. They see the recent drop as a way to remove speculation, not as a sign that the long-term positive outlook has changed.
Gold Technical Outlook: Buyers Eye the $5,100 Barrier
On the two-hour chart, gold is starting to form a base near $4,965. The strong rebound from the $4,718 support area, shown by heavy buying, suggests a local bottom might have formed.
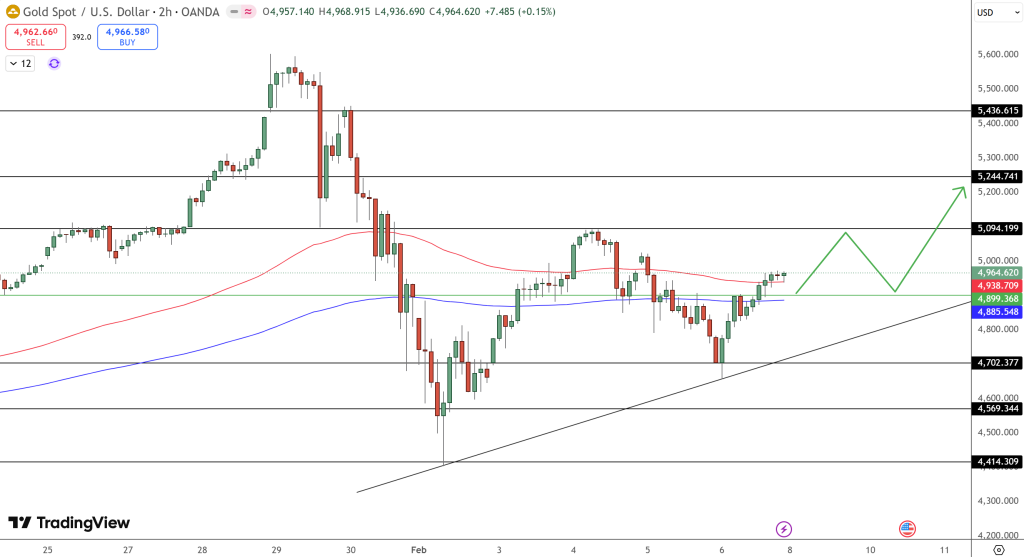
| Level Type | Price Target | Significance |
| Resistance 2 | $5,170 | 61.8% Fibonacci retracement level. |
| Resistance 1 | $5,057 | Immediate psychological barrier and 50 EMA. |
| Pivot Zone | $4,940 – $4,980 | Current consolidation range; must hold for bullish continuation. |
| Support 1 | $4,831 | First line of defense for the week ahead. |
| Support 2 | $4,718 | Major trendline support from January lows. |
Indicators Update:
- RSI is moving back up toward 48, which is neutral, after dropping below 20 during the crash.
- CME Margins: Recent hikes in margin requirements (now at 9%) have flushed out high-leverage retail traders, leaving the market “thinner” but more structurally sound.
Trade Strategy for Feb 9 – Feb 13
The long-term trend is still positive, with J.P. Morgan expecting prices above $6,000 by year-end. However, short-term trading needs careful timing.
- The Play: Look for buy entries on pullbacks near $4,900.
- Upside Target: A clean break above $5,100 confirms the recovery and opens the door to $5,245.
Risk Management: Tight stops are essential. A daily close below $4,700 invalidates the recovery thesis and suggests a deeper correction toward $4,400.
- Check out our free forex signals
- Follow the top economic events on FX Leaders economic calendar
- Trade better, discover more Forex Trading Strategies
- Open a FREE Trading Account
- Read our latest reviews on: Avatrade, Exness, HFM and XM
Related Articles


Sidebar rates
Related Posts
