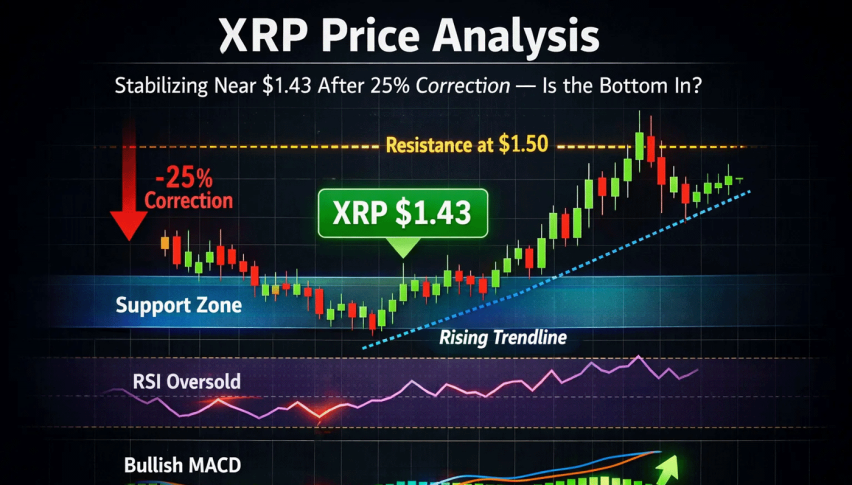
XRP Price Analysis: Stabilizing Near $1.43 After 25% Correction — Is the Bottom In?
Ripple (XRP) is stabilizing after dropping from its mid-January high near $1.94. Following a technical breakdown to a low of $1.21...
Quick overview
- Ripple (XRP) is stabilizing around $1.44 after a significant drop from its mid-January high of $1.94.
- The price has shown less volatility on the 4-hour chart, bouncing from a low of $1.21 and moving above the 0.382 Fibonacci retracement level at $1.43.
- Key resistance levels are identified between $1.53 and $1.62, while immediate support is at $1.43, with a potential retest of $1.31 if it fails.
- Market conditions remain cautious due to macroeconomic factors, and traders are advised to buy dips near $1.43 with specific target and stop-loss levels.
Ripple (XRP) is stabilizing after dropping from its mid-January high near $1.94. Following a technical breakdown to a low of $1.21, XRP now shows less volatility on the 4-hour chart. As of February 8, 2026, it trades around $1.44, just above a key Fibonacci support.
Bearish Channel Breakdown and the Quest for Support
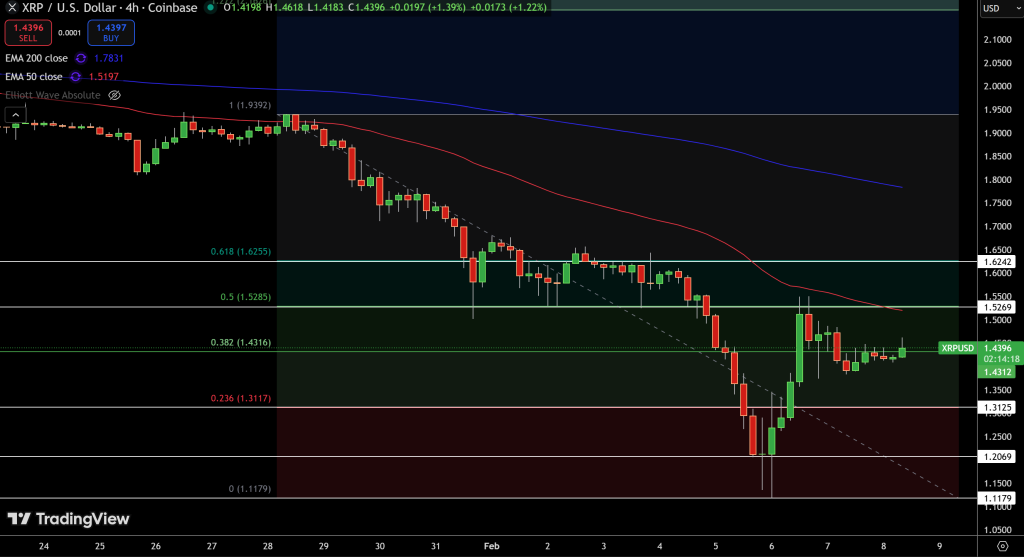
From late January to early February, XRP moved in a clear bearish pattern within a descending channel. The price was repeatedly pushed back by the 50-period Exponential Moving Average (EMA) near $1.52, which acted as resistance.
The sell-off grew worse as market liquidations, totaling over $775 million across crypto, pushed XRP below the key $1.50 support. However, XRP recently bounced from $1.21 (the 0 Fibonacci extension), with long lower wicks showing signs of dip-buying and short-covering.
Key Technical Levels to Watch
XRP has moved back above the 0.382 Fibonacci retracement at $1.43, turning it from resistance into short-term support. The recent price action shows smaller candles, which suggests last week’s heavy selling is slowing down.
- Immediate Support: $1.43 (0.382 Fib). A failure here could lead to a retest of the $1.31 liquidity zone.
- Primary Resistance: $1.53 – $1.62. This zone is a “confluence” area where the 0.5 and 0.618 Fib levels align with the prior 2025 breakdown point.
- The Trend Trigger: Analysts note that a decisive close above the 200-day EMA (currently near $2.20) would be required to shift the macro bias from bearish back to bullish.
Momentum Indicators: Neutrality Reached
The Relative Strength Index (RSI) dropped to a very low level near 20 during the February 5th crash but has now recovered to about 45. This sideways move shows the market is shifting from panic to consolidation.
On-chain data also supports a cautious approach. Whale inflows to exchanges jumped during the crash, but the Chaikin Money Flow (CMF) is now rising, which may mean institutional investors are buying at these lower prices.
Trade Setup: The “Base Formation” Play
For active traders, the current price range gives a clear risk-to-reward setup as XRP tries to form a base.
- Trade Idea: Buy the dips near $1.43.
- Target: $1.53 (Take-profit 1) and $1.60 (Take-profit 2).
- Stop-Loss: Below $1.31 (invalidates the short-term recovery thesis).
Market Note: Macro headwinds remain, with the recent nomination of Kevin Warsh as Fed Chair leading to expectations of a leaner Fed balance sheet. Until ETF flows for XRP stabilize, volatility is expected to remain high.
- Check out our free forex signals
- Follow the top economic events on FX Leaders economic calendar
- Trade better, discover more Forex Trading Strategies
- Open a FREE Trading Account
- Read our latest reviews on: Avatrade, Exness, HFM and XM
Related Articles


Sidebar rates
Related Posts
