Ethereum Stalls at Critical $1,900 Support: Technical Compression Meets Altcoin Exhaustion
Ethereum (ETH) is currently trading between $1,900 and $1,957, essentially unchanged from the previous day but recovering from a larger
Quick overview
- Ethereum is trading between $1,900 and $1,957, showing little change but recovering from a monthly decline.
- Bitcoin's market dominance has increased to 58.29%, causing capital to shift from Ethereum to Bitcoin, impacting ETH's performance.
- ETH faces resistance at $1,985, with a bearish trend line complicating bullish attempts, while support is found at $1,935.
- The overall outlook for Ethereum remains neutral to bearish, with potential for a breakout if it reclaims $2,000 on high volume.
Ethereum ETH/USD is currently trading between $1,900 and $1,957, essentially unchanged from the previous day but recovering from a larger monthly setback. Bulls are being held back by a mix of sector-wide capital rotation into Bitcoin BTC/USD and unresolved technical resistance, although fractal patterns and a stabilizing RSI suggest that a directional move might be imminent.
Bitcoin Dominance Is the Real Headwind for ETH Right Now
There is more to Ethereum’s slight 0.68% drop than meets the eye. The market dominance of Bitcoin has increased to 58.29%, while the Altcoin Season Index has fallen 16.67% to a reading of barely 30. The market’s message is unmistakable: money is shifting defensively from higher-beta altcoins like Ethereum to Bitcoin.
This weakening is not being caused by any fundamental catalyst unique to Ethereum. The mechanical selling is due to portfolio reallocation rather than a breakdown in the fundamental idea of ETH. Nevertheless, the rotation pressure on ETH is probably going to increase before decreasing if Bitcoin dominance clearly rises above 59%.
$1,985 Is the Level ETH Bulls Must Crack, and They’re Struggling
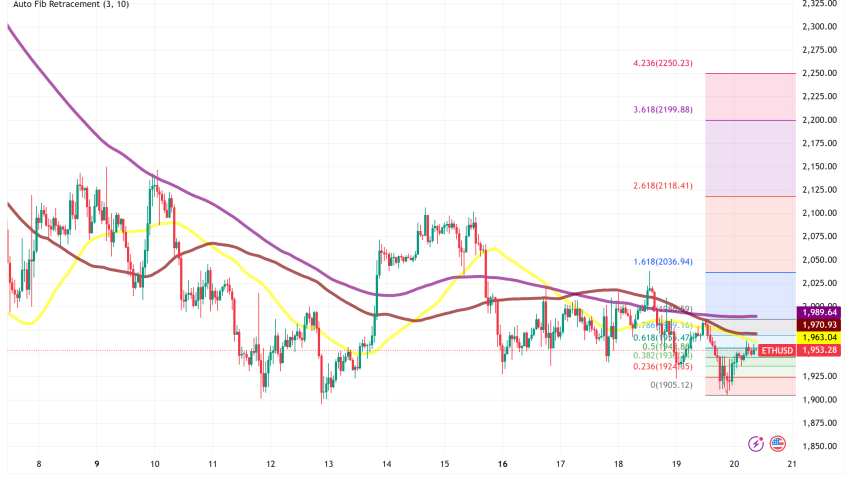
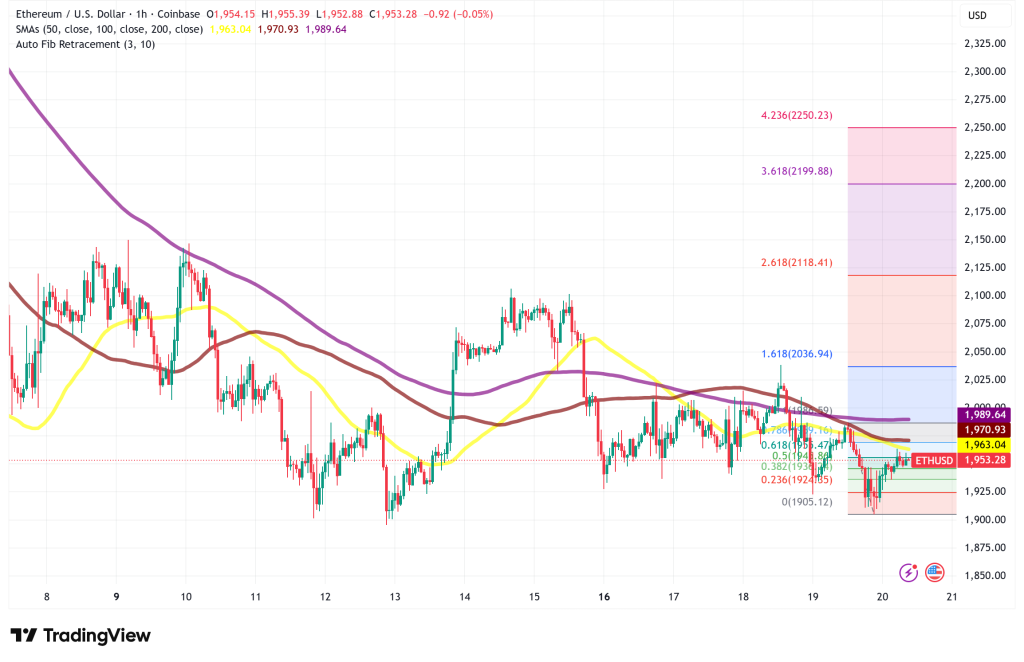
Before rising again into the $1,950s, ETH made a local low on the hourly chart at $1,905. The price is currently positioned between a wall of resistance grouped about $1,985, where a bearish trend line has also developed, and immediate support at $1,935 (the 61.8% Fibonacci retracement of the $2,038-to-$1,905 swing). Overhead friction is increased by the 100-hourly Simple Moving Average, which is somewhat above the current price.
Volume is also telling the story: 24-hour trading volume fell 10.13%, indicating that neither bears nor bulls are making a strong case. This is consolidation, not surrender, but consolidation that, until it is demonstrated otherwise, is bearish.
An optimistic early indicator would be a comeback above $1,970, which is the 50% Fib level. A road toward $2,050 and possibly $2,120–$2,150 becomes available if $2,000 is broken consistently. On the down side, a volume loss of $1,905 would probably reveal $1,880 and the $1,840–$1,820 support area.
The Bigger Picture: A Structural Breakdown with a Fractal Silver Lining
The damage is more noticeable when zoomed out. The crucial $2,100–$2,300 daily support zone that has been subject to selling pressure on several occasions in recent months has been lost by Ethereum. In a classic broken-support-becomes-resistance dynamic, that range has now switched to resistance, and attempts to regain it have been met with rejection thus far.
The next significant demand zone, a significant decline from current levels, is between $1,500 and $1,700 if bearish momentum continues to grow.
ETH seems to be developing a rectangular consolidation box that closely resembles the structure that preceded its big run in late 2025, according to weekly chart analysts, who are pointing to a possibly positive fractal. Prolonged compression inside the present range may be setting the stage for a sharp breakout rather than a breakdown if the pattern rhymes.
Ethereum Price Outlook: Neutral-to-Bearish, But Watch These Triggers
The market hasn’t rolled over yet, but it is losing momentum, as evidenced by the hourly RSI staying above 50 and the MACD remaining in positive territory, albeit fading. While ETH is still trading below $1,985, the short-term bias is neutral to bearish. The outlook would change with a $2,000 high-volume reclaim. The bears’ return to control would be confirmed by a close below $1,905.
A large portion of the speculative excess has been flushed, as the open interest in derivatives has decreased by almost 30% over the last week. Historically, this can pave the way for the next significant move, either way.
- Check out our free forex signals
- Follow the top economic events on FX Leaders economic calendar
- Trade better, discover more Forex Trading Strategies
- Open a FREE Trading Account
- Read our latest reviews on: Avatrade, Exness, HFM and XM
Related Articles


Sidebar rates
Related Posts
