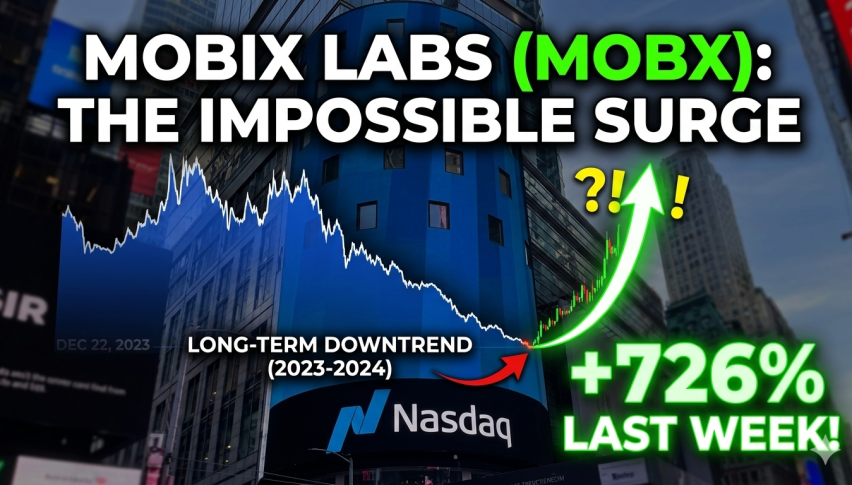
Mobix Labs (MOBX) stock surged approximately 726% last week after a prolonged downtrend, but remains 95% below its all-time high.
The stock is currently testing a critical Fibonacci support level at $0.55, which could determine its short-term trajectory.
Despite the recent rally, technical indicators suggest a bearish outlook, with a death cross on the daily chart and weakening momentum.
Traders are advised to exercise caution and implement strict risk management strategies due to the stock's extreme volatility.
Mobix Labs (MOBX) stock remains deeply depressed, trading roughly 95% below its all-time high near $12.5 reached in 2023. However, after a prolonged downtrend and capitulation phase, the stock suddenly ignited a parabolic surge last week, attracting significant speculative momentum and trading volume.
Such explosive moves following extreme drawdowns often raise a critical question for traders and investors alike: is this the beginning of a sustainable trend reversal, or merely a classic dead cat bounce within a broader long-term downtrend?
Mobix Labs Surged by Roughly 726% Last Week
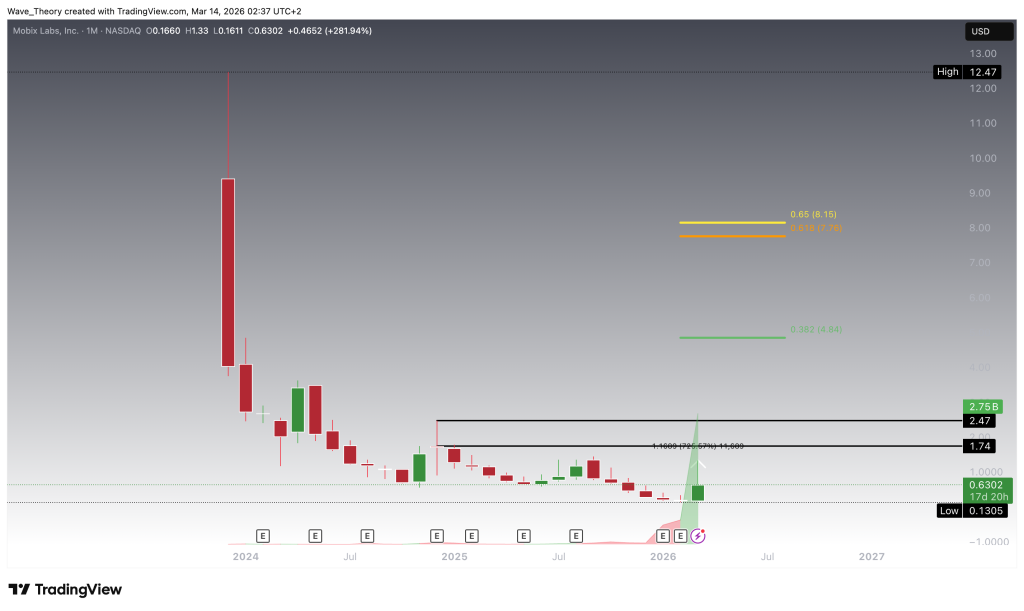
Mobix Labs (MOBX) has recorded an extraordinary surge of roughly 726% over the past month, marking a dramatic reversal in momentum after the stock had been in a persistent downtrend since its listing on the Nasdaq in 2023. The magnitude of this rally reflects a sharp influx of speculative buying pressure following a prolonged period of price depreciation.
If the current upward momentum continues, the stock is likely to encounter its next significant resistance zone between $1.74 and $2.47, which represents the next notable technical barrier in the short term.
However, from a broader structural perspective, Mobix Labs remains within its long-term downtrend. To invalidate this bearish structure and establish the foundation for a new sustained uptrend, the stock would need to break through the key Fibonacci resistance levels at $4.84 and $8.15. At present, these levels remain well out of reach, suggesting that the current surge should still be viewed within the context of a larger corrective structure unless additional bullish follow-through materializes.
MOBX
MOBX Stock Now Hits Significant Golden Ratio Support
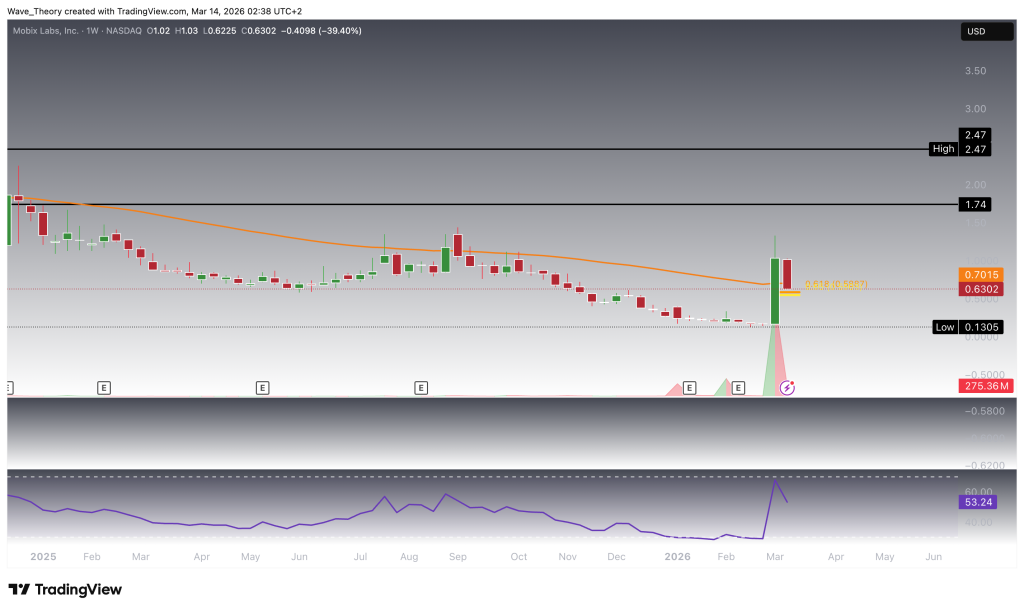
Following the 726% surge last week, Mobix Labs (MOBX) has retraced sharply this week, with the price declining from $1.33 to approximately $0.63. During this pullback, the stock fell below the 50-week EMA support at $0.70, weakening the short-term structure of the rally.
The price now approaches a significant Fibonacci support level at the golden ratio near $0.55, which represents a critical technical area where buyers could step in and trigger a bullish bounce.
Should such a rebound occur, the stock could resume its upward trajectory, potentially pushing the price back toward the next major resistance zone between $1.74 and $2.47.
At present, however, the technical indicators provide limited directional signals. The RSI continues to move in neutral territory, reflecting a lack of clear momentum bias as the market consolidates near this key Fibonacci support level.
MOBX
Death Cross on the Daily Chart Prevails For Mobix Labs
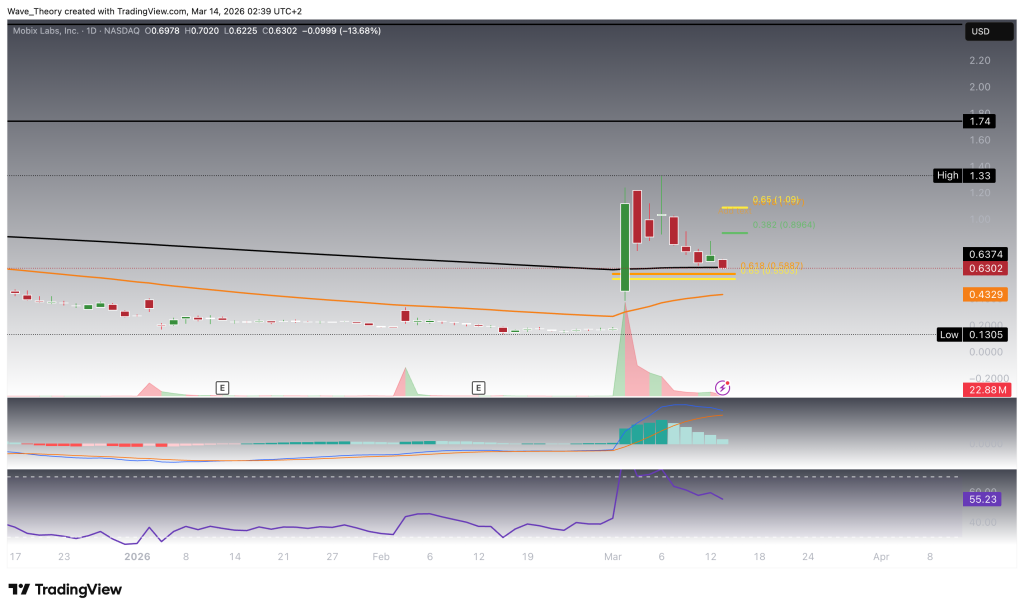
On the daily timeframe, Mobix Labs (MOBX) presents a rather bearish technical outlook. The EMAs remain locked in a bearish death cross, which confirms the short- to medium-term trend bearishly. In addition, the MACD histogram has been trending lower for the past five days, indicating weakening momentum, while the MACD lines are approaching a potential bearish crossover. At the same time, the RSI has exited overbought territory and returned to neutral levels, signaling that the recent upside momentum has cooled considerably.
If the stock manages to bounce from the golden ratio support near $0.55, it could initiate another upward move toward the next Fibonacci resistance levels at $0.89 and $1.09. A decisive breakout above the golden ratio resistance at $1.09 would invalidate the current correction phase. However, even in that scenario, the broader long-term trend would still remain bearish, given the substantial structural decline since the stock’s earlier highs.
MOBX
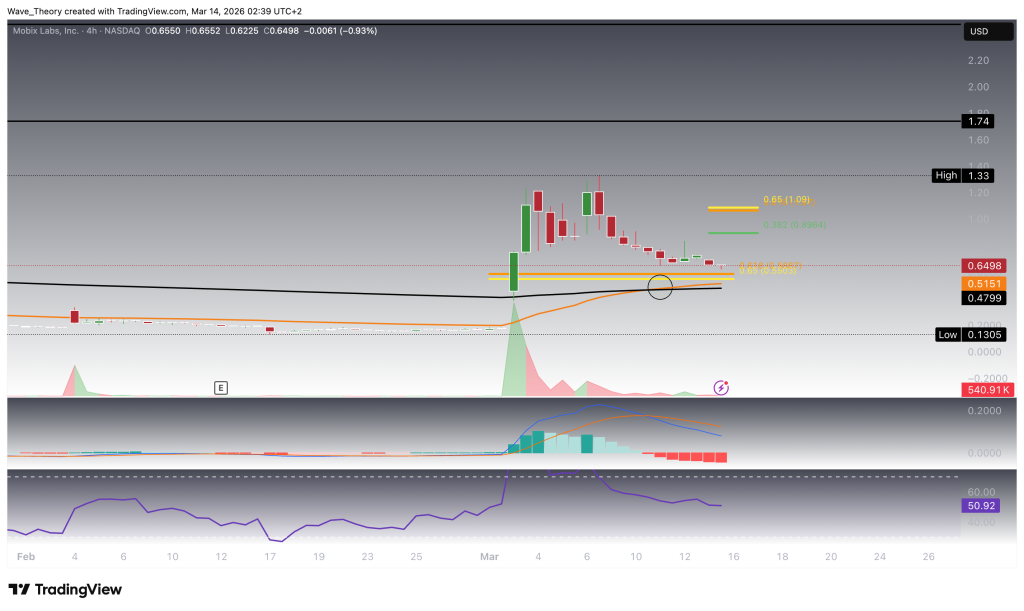
Golden Crossover Emerges on the 4H Chart: Bullish Trend Confirmation for MOBX Stock
On the 4-hour timeframe, Mobix Labs (MOBX) presents a constructive short-term development, as the EMAs have formed a golden crossover, confirming the trend bullishly in the short term. However, momentum indicators paint a more cautious picture. The MACD lines remain bearishly crossed, while the MACD histogram continues to extend its recent downtrend, indicating weakening momentum despite the bullish EMA structure. Meanwhile, the RSI remains positioned in neutral territory, offering no clear directional signal.
Despite the sharp bearish response and a drawback of roughly 53% following the prior 726% surge, MOBX still retains the potential to bounce from the golden ratio support around $0.55 and potentially resume its upward trajectory.
Nevertheless, caution is clearly warranted. A decisive break below the $0.55 support could trigger a substantial continuation of the decline, potentially pushing the stock back toward its previous low near $0.13 or even lower. In such a scenario, a position could lose a significant portion of its initial investment capital.
Therefore, entering this trade should be approached with strict caution and disciplined risk management, including the use of proper stop-loss levels to mitigate downside exposure.
MOBX
MOBX Stock: Key Levels and Outlook
Mobix Labs (MOBX) recently delivered an extraordinary 726% surge, temporarily interrupting the prolonged downtrend that has persisted since its Nasdaq listing in 2023. However, the rally was followed by a sharp 53% pullback, bringing the stock down toward a critical Fibonacci golden ratio support at $0.55.
If MOBX manages to hold and bounce from this key support, the stock could attempt another recovery toward $0.89 and $1.09, with further upside potentially targeting the major resistance zone between $1.74 and $2.47. A decisive breakout above $1.09 would invalidate the current correction phase, although the long-term trend would still remain bearish.
Conversely, a breakdown below the $0.55 golden ratio support could trigger a steep continuation of the decline, potentially sending the price back toward the prior low near $0.13 or even lower. Given the extreme volatility following the recent parabolic rally, traders should approach MOBX with caution and apply strict risk management, including the use of well-defined stop-loss levels.
Konstantin Kaiser comes from a data science background and has significant experience in quantitative trading. His interest in technology took a notable turn in 2013 when he discovered Bitcoin and was instantly intrigued by the potential of this disruptive technology.