Bitcoin Holds $68K as Strategy’s Buying Spree Battles Bear Flag: Can BTC Break to $110K?
On Tuesday, April 7, Bitcoin (BTC) is continuously trading above $68,000, maintaining a narrow range that has lasted for weeks. Despite the
Quick overview
- Bitcoin is trading above $68,000, maintaining a narrow range despite unfavorable social media sentiment and a deep Fear and Greed Index.
- A bear flag pattern suggests a potential breakdown toward sub-$50,000, but significant buying by Michael Saylor's Strategy is impacting supply dynamics.
- The 200-week simple moving average is providing crucial support, reminiscent of Bitcoin's 2018 cycle bottom before a major rally.
- Near-term predictions suggest Bitcoin could reach $72,000 if support holds, with a breakout potentially leading to targets between $108,000 and $110,000.
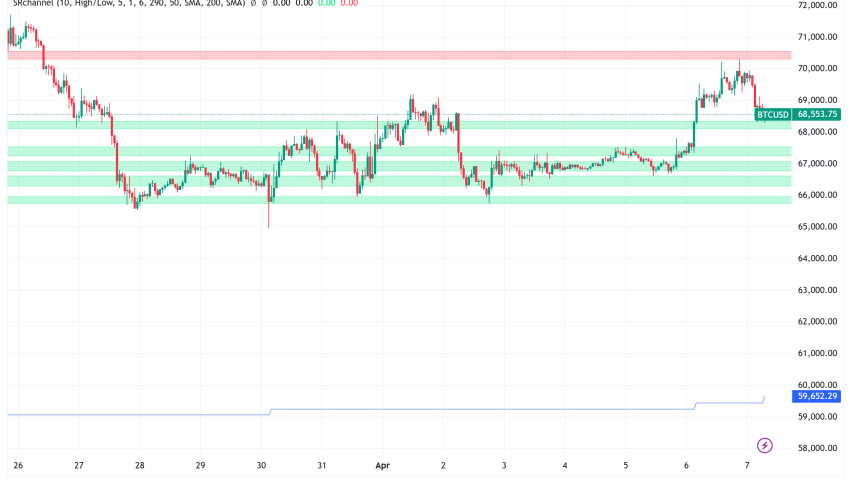
On Tuesday, April 7, Bitcoin BTC/USD is continuously trading above $68,000, maintaining a narrow range that has lasted for weeks. Despite the most unfavorable social media sentiment since the Iran conflict started in late February, the cryptocurrency has largely stayed inside a $65,000 to $73,000 band. The Fear and Greed Index, which has been stuck between 8 and 14 for more than a month, is deep in extreme dread territory. However, the price has refused to plummet, a stalemate that analysts who are waiting for a clear breakout or breakdown are becoming more and more interested in.

Bear Flag on the Chart, But Strategy Is Spoiling the Setup
Technically speaking, Bitcoin is still trapped in a bear flag pattern after a precipitous previous plunge. A possible breakdown toward sub-$50,000, or about 30% below current levels, is projected by the formation. Bear flags, which indicate that there is not enough demand to stop the general slump, are usually bearish continuation indications.
But one buyer is completely rewriting the supply-demand formula. Michael Saylor’s Strategy has bought 46,233 BTC since the beginning of March, yet the Bitcoin network only created about 16,200 new coins through mining during that time. This means that Strategy has taken in over three times the amount of fresh supply created. In order to finance a $330 million Bitcoin buy, Strategy obtained $102.6 million through its STRC preferred shares just last week. In the days that followed, Bitcoin increased by more than 6.65%.
The upper trendline of the bear flag around the mid-$70,000s is the crucial upside level to keep an eye on. A verified daily close above that level would disprove the bear pattern and pave the way for a measured-move goal between $108,000 and $110,000.
A 2018 Echo? The 200-Week SMA Is the Crucial Support
Experienced chart watchers are comparing Bitcoin’s 2018 cycle bottom, when a rising wedge threatened a significant collapse, to the price’s subsequent reversal and roughly 1,975% rally. With the 200-week simple moving average (SMA) serving as a stable floor below spot price, a similar dynamic might be taking place right now.
That was the lowest point of Bitcoin in 2018 before its remarkable comeback. The longer-term weekly 200-week SMA has so far restricted the loss, supporting the bull argument for patient holders, while the 200-day moving average has been declining since early March 2026, indicating near-term decline Changelly.
Geopolitics: The Iran Wildcard
The prolonged impasse between the United States and Iran over the Strait of Hormuz adds even another level of complexity. Iran was given a deadline by President Trump on Tuesday, and markets are interpreting the conflicting signals. After a Reuters article indicated that a ceasefire proposal between the US and Iran would be implemented, possibly reopening the Strait of Hormuz, Bitcoin surged more than 4% in a single day to almost $70,000. However, the consequences for Bitcoin are reciprocal.
Although a ceasefire would probably increase stock prices and allay concerns about inflation, it may also lessen the need to hold decentralized, non-sovereign assets. On the other hand, a breakdown in talks might strengthen Bitcoin’s reputation as a hedge against geopolitical and fiscal instability. This is especially important given the sharp increase in US Treasury yields and the liquidation of gold reserves by central banks like Russia and Turkey in order to stabilize their currencies.
Bitcoin Price Prediction: $75K Near-Term, $110K If the Pattern Breaks
According to near-term technical analysis, if the $67,500 support zone holds on a consistent daily close basis, Bitcoin might increase 5%–7% and reach about $72,000 by mid-April. No overbought or oversold extremes indicate an impending reversal, and the RSI is still in neutral territory.
The larger picture, however, depends on two factors: whether the US-Iran conflict is resolved amicably enough to increase risk appetite, and whether Strategy’s STRC funding stays over par (allowing continuing aggressive BTC purchases). A breakout over the upper trendline of the bear flag might lead to a quick rally toward the $108,000–$110,000 measured-move goal if both are in line. Although such scenario hinges on factors far outside present market conditions, some ambitious analysts have indicated that $400,000 is achievable if Strategy maintains its current purchasing rate indefinitely.
- Check out our free forex signals
- Follow the top economic events on FX Leaders economic calendar
- Trade better, discover more Forex Trading Strategies
- Open a FREE Trading Account
- Read our latest reviews on: Avatrade, Exness, HFM and XM
Related Articles


Sidebar rates
Related Posts
