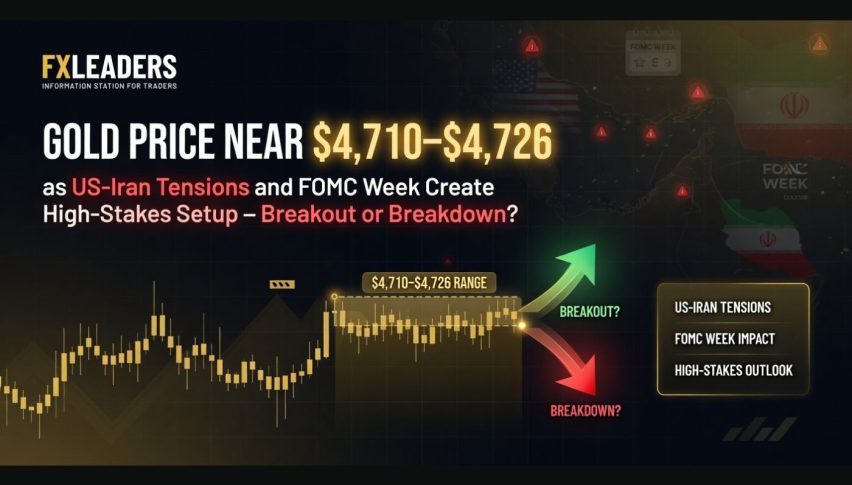
Gold Price Near $4,710–$4,726 as US-Iran Tensions and FOMC Week Create High-Stakes Setup – Breakout or Breakdown?
As of April 27, 2026 (about mid-morning, when the early trading got underway) gold is trading somewhere between $4,710 and $4,726...
Quick overview
- As of April 27, 2026, gold is trading between $4,710 and $4,726 per ounce, having recently reversed some earlier losses.
- Gold has dropped around 2-2.5% over the past week, ending a four-week winning streak, but remains up over 40% year-over-year.
- Key factors affecting gold prices include US-Iran developments, a stronger dollar, and ongoing demand from central banks and countries like India and China.
- Upcoming macro events, including the FOMC meeting and GDP data, could significantly influence gold's market outlook.
As of April 27, 2026 (about mid-morning, when the early trading got underway) gold is trading somewhere between $4,710 and $4,726 per ounce.
- Recent movement: Gold is up a modest amount (around 0.02-0.4% through the day) after reversing some of the losses it had seen earlier. It didn’t come out unscathed from the week, snapping a four-week winning streak by dropping around 2-2.5%, and now it’s stuck in a consolidation range after hitting a recent low of $4,655-$4,680.
- Context: Gold is still up around 40%+ year-over-year, but its far off from its all time high of $5,600-$5,608, back in January 2026.
Key Factors Impacting Gold Today
- US Iran Developments: Well, it’s all over the place – we’ve got reports coming in about a new proposal from Iran (via mediators) to open up the Strait of Hormuz and put an end to the conflict, which is pretty encouraging and has the potential to soften the dollar a bit. But on the other hand, its difficult to make progress in the talks, there’s still a blockade in place, and tensions are still running high – which is keeping the risk premium in the market at a reasonable level.
- Dollar and Yields: Lately the dollar has been a bit stronger and bond yields have been rising, which has had a negative impact on gold – mainly because it suggests that higher energy-driven inflation is on the horizon.
- Physical/Structural Support: Central banks still buying, a steady flow of interest in ETFs, and demand from countries like India and China is still there – So that’s providing some support, even though the high prices are dampening some of the demand for gold jewelry.
Upcoming Big Macro Events to Watch (April 24-30, 2026)
- April 28-29: FOMC Meeting and Powell Press Conference – Big deal. The Fed is expected to keep interest rates where they are (3.50-3.75%). But the key will be the inflation outlook amid the oil shocks, and of course, how Powell approaches the situation.
- April 30: Q1 GDP (preliminary), PCE Deflator, Personal Income/Spending – These are going to be critical for getting a read on inflation and the state of the economy.
- Early May: April CPI/PPI – This will be key for figuring out just how bad the war-driven inflation trends really are.
If stronger data comes out, it could reinforce the idea that interest rates are going to stay high (which is bad news for gold); but if the numbers are soft, it could mean a boost to safe haven flows.
Gold (XAU/USD) Technical Analysis
Gold (XAU/USD) is heading into the new week trading around $4,712, and it’s stuck in a pretty tight symmetrical triangle on the 4H chart. Price action is sort of caught between a line dropping down from the $4,900 high and a line going up from the $4,300 base – creating a pretty volatile squeeze.
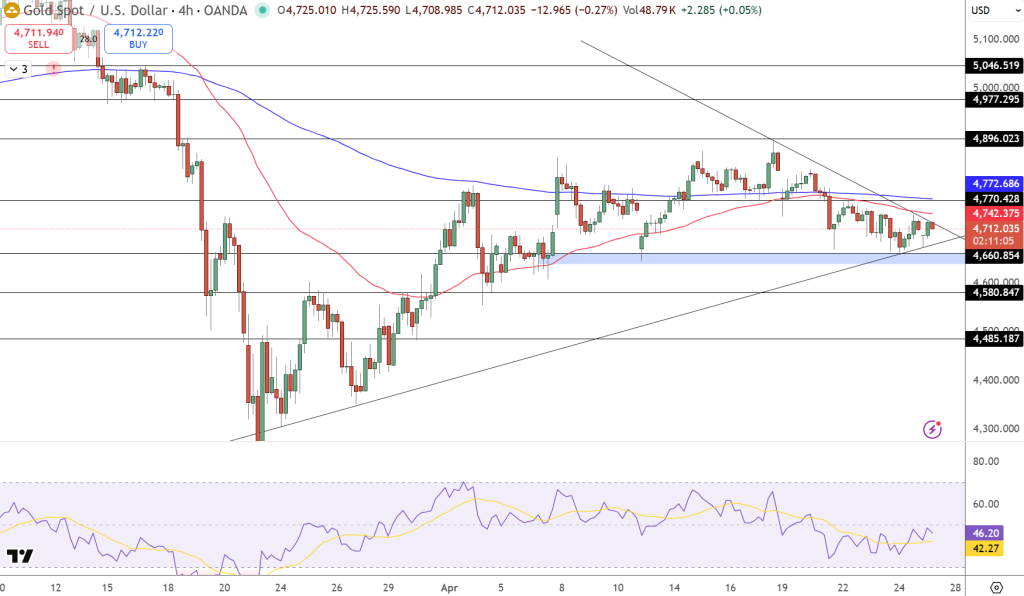
The $4,660 zone is still a pretty important horizonal support, because its where there’s been prior demand and some repeated price reactions. And resistance is all bunched up around $4,770-$4,780, which just so happens to align with the 200 EMA.
The 50 EMA near $4,740 is really acting as a bit of a wall – preventing gold from going higher. It’s also worth noting that the RSI is sitting in the 42-46 range, which is basically saying that the momentum is pretty weak and actually has a slight bearish tilt.
Key Levels
- Resistance: $4,770-$4,780 – then up to $4,896
- Support: $4,660 – then down to $4,580 – and way down to $4,485
Trade Idea: Buy above $4,770 with a target of $4,896 and a stop loss below $4,660.
- Check out our free forex signals
- Follow the top economic events on FX Leaders economic calendar
- Trade better, discover more Forex Trading Strategies
- Open a FREE Trading Account
- Read our latest reviews on: Avatrade, Exness, HFM and XM
Related Articles

Sidebar rates
Related Posts
