Gold Price Daily Outlook: Will Trendline Bounces Spark a Gold Recovery Past $4,520?
Spot gold (XAU/USD) found itself at a very key, structural testing area on Thursday, falling to trade at 4,477.76 following a minor 0.08%...
Quick overview
- Spot gold (XAU/USD) is testing a critical support level at 4,477.76 amid a restrictive interest rate environment.
- The Federal Reserve's hawkish stance and persistent inflation are leading to higher real yields and a stronger U.S. Dollar.
- Central banks, particularly the People's Bank of China, continue to accumulate physical gold, providing a long-term support for prices.
- A potential long trade is suggested as gold approaches dynamic support levels between 4,451.00 and 4,455.00.
Spot gold (XAU/USD) found itself at a very key, structural testing area on Thursday, falling to trade at 4,477.76 following a minor 0.08% localized intraday cooling block, and it will be compressing hard against the multi-touch support vector on the two-hour chart of the primary safe-haven macro asset as the paper market is liquidated due to a highly restrictive interest rate environment as official sector central bank accumulation continues in the background.
Here are today’s gold price action key drivers:
- Warsh “Hawk” Regime: Global capital allocation is adjusting to highly restrictive monetary policy conditions of newly sworn in Federal Reserve Chairman Kevin Warsh’s hawk regime with April CPI coming in at a sticky 3.8% headline inflation reading and a core of 4.1% has caused trading desks to quickly backpedal near-term interest rate cut expectations leading to higher real yields and a firm bid on the U.S. Dollar Index
- 17-Month Central Bank Cushion: the most fundamental anchor of a deep macro breakdown is the sustained official sector accumulation of physical gold bullion through the People’s Bank of China continuing its long-term aggressive physical bullion buy streak for over 17 consecutive months now along with the emerging market central banks as futures markets are systematically being soaked up
- Ceasefire Stability Eases Safe-Haven Demand: the conditional U.S.-Iran ceasefire is holding on the ninth week now despite localized tensions as commercial maritime shipping in the strategic Strait of Hormuz is continuing to recover to 75 to 82% of normal pre-crisis capacity levels thereby continuing to bleed out the acute geopolitical risk premium that has powered gold earlier in the year.
Technical Analysis:
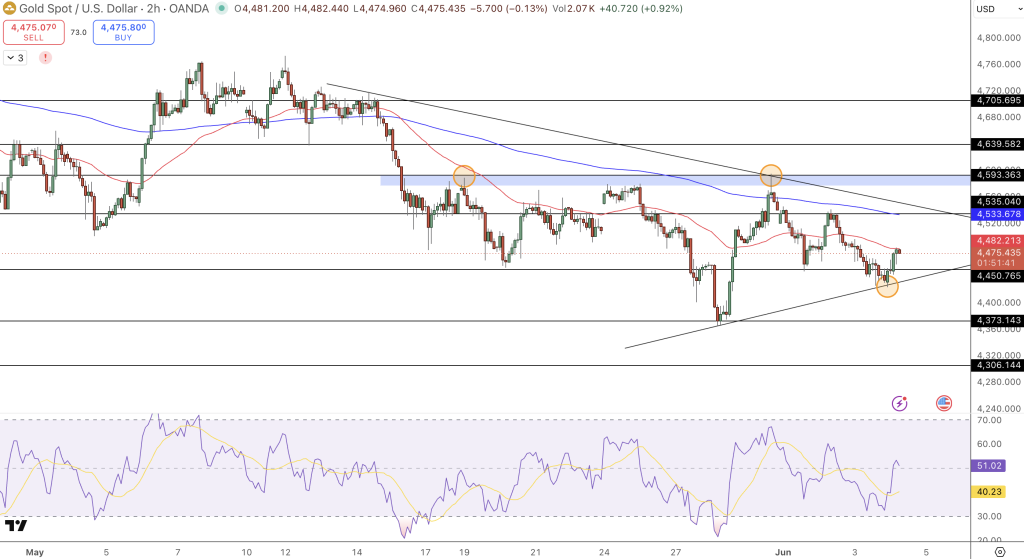
The two-hour chart clearly shows the parallel descending channel corrective structure from the May peaks, but the focal point intraday will focus on the high compression area as friction from the overhead channel meets the trendline support from below as price is getting pinned to a critical multi-week ascending black trendline support near 4,450.77 as this level has historically proven effective in terms of responsive buying, as highlighted in the chart by the prior orange circle lower shadows as a series of red bodies have led the recent decline over multiple sessions but the latest candles show mixed bodies and short-term indecision as the 14-period relative strength index (RSI) at 51.93 remains exactly neutral as there is plenty of equilibrium for a strong, springy directional move.
- Key Resistance: Immediate horizontal pivot at 4,520.00, 4,533.70 overhead trendline resistance, and major pattern supply at 4,595.40.
- Key Support: Immediate dynamic trendline support at 4,450.77, immediate horizontal validation at 4,406.63 and major pattern structure at 4,373.14.
Gold Price Action Trade Idea:
A highly structured mean reversion long as price touches a high point of compression of the pattern as it bounces off the historical horizontal and dynamic support shelf as follows:
- Trade: Long Buy Limit as price hits 4,451.00 to 4,455.00 dynamic support levels
- Take profit 1: 4,520.00
- Take profit 2: 4,533.70
- Stop Loss: 4,406.00 Just below the local support invalidation floor of the immediate trendline.
Summary:
Our short-term gold price action forecast says the market is currently going through a critical liquidity test to see if buyers can maintain a defensive position off the multiple touch support as there is strong intermediate headwinds for macro dollar bulls due to the ongoing inflation prints and Warsh’s hawk central banking policy, but the key theme remains that the longer term appeal of a sovereign wealth hedge and gold as a global debt insurance policy should remain intact as a highly supported floor, so traders should avoid chasing the mid-range move of the price wicks as there is plenty of clean risk defined parameters in the 4,450 level as we position for the next major pattern rotation.
- Check out our free forex signals
- Follow the top economic events on FX Leaders economic calendar
- Trade better, discover more Forex Trading Strategies
- Open a FREE Trading Account
- Read our latest reviews on: Avatrade, Exness, HFM and XM
Related Articles


Sidebar rates
Related Posts
