Gold Price Forecast: Bears Threaten $4,090 Target as Broken Trendline Solidifies Overhead Supply Ceiling
As early trading begins in early July 2026, global precious metals appear to be in major distribution phase. Monday, July 6, 2026...
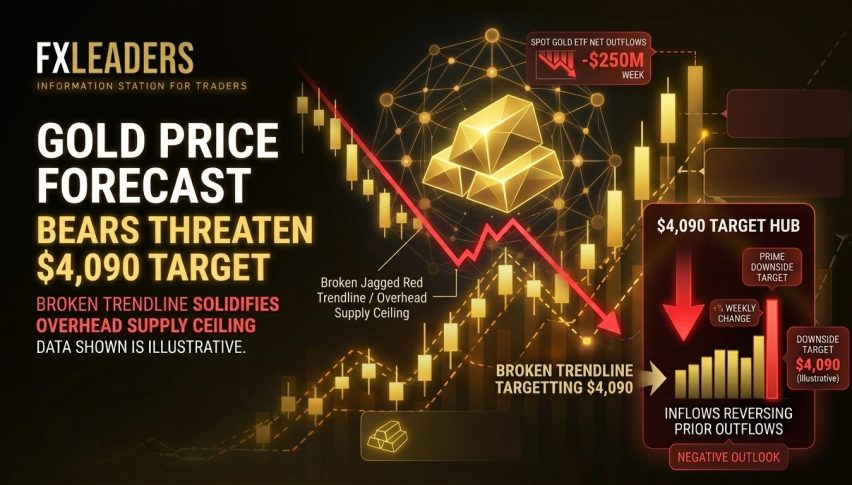
Quick overview
- As of July 6, 2026, spot gold is trading at $4,155.74/oz, indicating a major distribution phase in global precious metals.
- The implementation of the U.S.-Iran interim peace accord has led to a normalization of commodity prices and a decline in crude oil benchmarks.
- Federal Reserve Chair Kevin Warsh's hawkish monetary policy is increasing the opportunity cost of holding gold, resulting in systematic de-leveraging by global macro funds.
- Despite near-term paper liquidations, a 17-month buying streak by central banks provides a structural support for gold prices.
As early trading begins in early July 2026, global precious metals appear to be in major distribution phase. Monday, July 6, 2026 sees spot gold (XAU/USD) continuing its intraday corrective phase in early trade to change hands at $4,155.74/oz. Institutional desks and systematic portfolios are rebalancing against the changing macro landscape as paper prices fall deeper into discount territory given the full unwind of regional safe haven hedges collides with high global funding costs.
Islamabad MOU Rollout Anchors Commodity Price Normalization
The primary fundamental driver behind the sell-side flows within the precious metals space continues to be the smooth implementation of the U.S.-Iran interim peace accord, the Islamabad Memorandum of Understanding (US-Iran MoU). The landmark diplomatic agreement signed on June 19 in Switzerland has successfully concluded the severe military confrontation that marked early Q2.
Commercial trade flows through the strategic Strait of Hormuz have quickly re-normalized with passage volumes gradually recovering to roughly 85% of standard seasonal volume. This reemergence of conventional energy logistics precipitated a sharp decline in front-month Brent crude benchmarks to re-test sub-$73/bbl levels.
Though this de-escalation significantly reduces inputs costs for global mining, it also strips the war premium that propped up front-month bullion futures, thereby allowing traditional macro drivers to take back full control of daily price Discovery.
The Warsh Doctrine Hardens Alternative Asset Opportunity Costs
A major impediment to any structural recovery attempt is the highly hawkish stance being pursued by Federal Reserve Chair Kevin Warsh. Under the data-driven monetary policy framework solidified during the June 16-17 FOMC meeting, the US central bank has kept the funds rate at its all-time high in an effort to tame sticky consumer price data that includes a hot 4.1% core CPI print and a 3.8% headline read.
This “higher for longer” regime has kept real US Treasury yields and the US Dollar Index (DXY) well-bounded at multi-month peaks. Given that physical gold does not offer any interest or dividend income, the rising risk-free rate has sharply pushed higher the opportunity cost of holding bullion.
This dynamic has continued to result in systematic index de-leveraging as global macro funds continue to shed precious metal positions in order to lock-in risk-free sovereign bond yields.
17-Month Sovereign Buying Streak Limits Deep Macro Liquidation
The stark divide between near-term paper liquidations and long-term physical buying continues to be the fundamental pillar of the gold market. One of the more enduring underpinnings remains the official sector’s reserve diversification program, as witnessed by the People’s Bank of China (PBOC) increasing gold holdings for the 17th month straight.
Faced with intensifying great power rivalries, rising FX volatility and financial weaponization, emerging market central banks continue to rotate foreign reserves away from G7-denominated debt securities and into bullion. This continuous non-retail driven buying has acted as a permanent structural cushion to paper liquidations and provides physical support to spot prices that will avoid a freefall.
Gold (XAU/USD) Technical Analysis: 4H Chart Confirms Bearish Continuation Under Descending Trendline
Moving from central bank dot plots to the 4H spot gold chart, XAU/USD has continued to break out in a sell-off below its key structural levels. XAU/USD completed a further correction move to change hands at $4,155.74, staying well below its trailing 4H 200-EMA ($4,222.00), as sellers continue to control price action below its long-term descending trendline ($4,204.00).
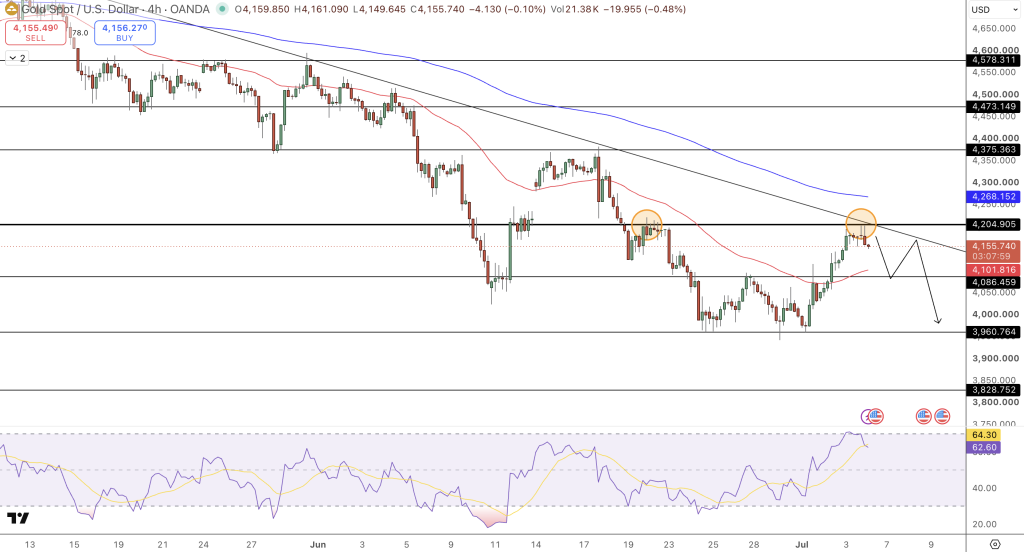
Sellers are able to hold price action inside of a lower low, lower high pattern beneath the descending trendline, as prior support shelves have successfully transformed into formidable overhead supply walls.
The 14-period RSI is currently hovering around mid-range (62.60), implying that the price correction has fully reset the market and providing plenty of headroom for the metal to drop further before entering oversold territory. The MACD histogram also reflects the bearish price bias, staying below the zero line and confirming that price is still selling off rallies.
Conclusion and Trade Idea
Gold is deep within a major post-geopolitical resolution phase where the unwinding of its war premium is allowing for macro bears to take the wheel under Warsh’s tough dollar policy. While the persistent 17-month buying streak from central banks will continue to provide a fundamental floor, the recent breakdown from the long-term descending trendline indicates that near-term rallies will face distribution at the previously broken support levels.
Continuation Trade Setup: Look to initiate a short position on a weak technical rally back to the long-term descending trendline resistance level at $4,204.00. Keep tight stop loss at $4,225.00, above the 4H 200-EMA, and look to ride down to the initial horizontal support at $4,091.00, then extending down to the major invalidation level of $4,024.00.
- Check out our free forex signals
- Follow the top economic events on FX Leaders economic calendar
- Trade better, discover more Forex Trading Strategies
- Open a FREE Trading Account
- Read our latest reviews on: Avatrade, Exness, HFM and XM

Related Articles


Sidebar rates

Related Posts
 Save
Save