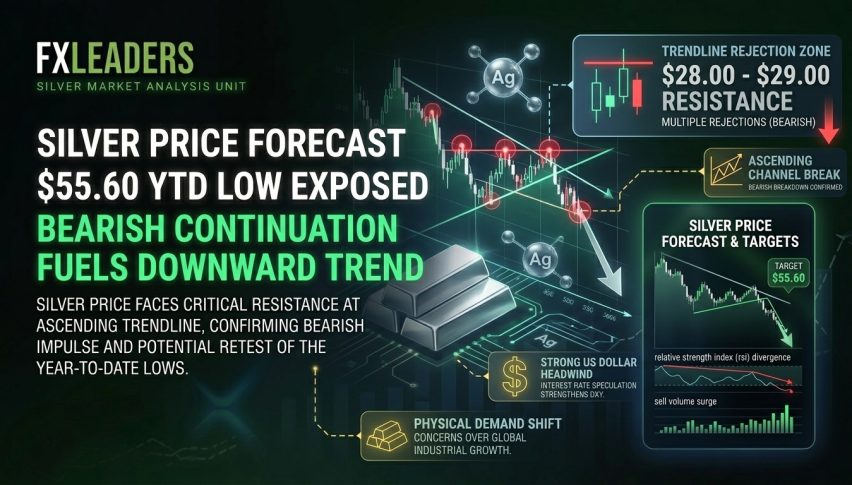
Silver Price Forecast: $55.60 Year-to-Date Low Exposed as Ascending Trendline Rejections Fuel Bearish Continuation
Global commodity derivatives markets are locking into a massive structural shift that lasts until at least early July 2026...
Quick overview
- Global commodity derivatives markets are undergoing a significant structural shift, impacting the valuation of precious metals until at least July 2026.
- The recent Islamabad MoU has reduced geopolitical risks, leading to a decline in safe-haven inflows into precious metals and a drop in crude oil prices.
- The U.S. Federal Reserve's restrictive interest rate policy is negatively affecting precious metals, as investors shift towards higher risk-free sovereign debt.
- Despite a six-year global physical shortage of silver, short-term bearish trends in paper markets and industrial demand destruction are pressuring prices lower.
Global commodity derivatives markets are locking into a massive structural shift that lasts until at least early July 2026, and as such, other stores of value are under extreme valuation decompression pressure in the interim. On Wednesday July 1 2026, spot silver (XAG/USD) was heavily dumped by commercial desk players as it breached below significant moving average levels and was trading near $57.39 an ounce.
Quantitative macro funds and other institutional producers were selling to rebalance as the new quarter turned, pricing the removal of all geopolitical risk in a Washington interest rate framework that is as restrictive as it gets.
Islamabad MoU Reshapes Maritime Energy Costs and Lightens Precious Metal Hedges
The dominant underlying fundamental driving the short-term sell of precious metals is the ongoing implementation of the “Islamabad Memorandum of Understanding” interim U.S. Iran peace treaty.
Signed in Switzerland on June 19 in a 14-point accord, the deal has effectively halted the Middle East military confrontation in the early part of the second quarter of the calendar year. In the aftermath, the full reopening of the Strait of Hormuz has facilitated commercial maritime shipping returning to approximately 85% of seasonal capacity as the front-month Brent price of crude oil has plummeted below the $73 a barrel threshold, undoing the war-fear premium on paper commodity futures.
While this has cooled safe-haven inflows into precious metals, it has also reduced global energy overhead costs, which will be supportive of the silver complex industrial base in the multi-month time frame.
The Warsh Fed framework is extremely negative for precious metals in the interim
The overriding barrier to recovery in the short-term for alternative stores of value is the extremely restrictive rate setting framework by Fed chairman Kevin Warsh. The Fed has kept interest rates at their peak following the data-dependent monetarist mandate agreed to during the Fed’s June 16-17 FOMC meeting, citing the hot 4.1% core CPI and 3.8% headline inflation.
The Warsh Fed is holding benchmark interest rates at the top, eliminating any fall rate-cut models, to support both the real yield of U.S. Treasuries and the U.S. Dollar Index (DXY). This puts enormous carrying costs on paper derivatives as global macro portfolios are unwinding their long exposure to precious metals for higher risk-free sovereign debt.
The six-year global physical shortage counters the solar and industrial thrift
The juxtaposition of the short-term liquidation in paper markets against long-term physical scarcity remains the core fundamental supporting the commodity. Newer global survey numbers from the Silver Institute indicate that the physical market is now in its sixth year running in a structural supply deficit, with a shortfall forecast of 46.3 million troy ounces for calendar-year 2026. Since 72% of global mine production comes from mining byproduct operations tied to base metals such as copper, zinc, and lead, miners can not increase mining production in the near term even if prices skyrocket.
Meanwhile, commercial demand from industrial fabrication markets such as computer servers, data centers for AI computing, and 5G infrastructure continues to remain elevated. On the paper trading side, bearish traders closely track a 19% decline year-over-year in the use of silver in solar panels.
This industrial demand destruction and substitution of material is a headwind to the spot price, at the time of this article’s publication, and provides short-term buyers room to run prices lower into deep value areas before higher long-term fundamentals come to the fore.
Technical Overview: 2H Spot Silver Price Breakdown Continues below the Rising Blue Ascending Trendline
Spot silver on the 2-hour chart shows a clean and easily readable continuation breakdown below the immediate support trendlines. Silver (XAG/USD) fell -2.04% to trade at a low of $57.39 to the downside of the rising blue short-term trendline resistance line, below recent local highs.
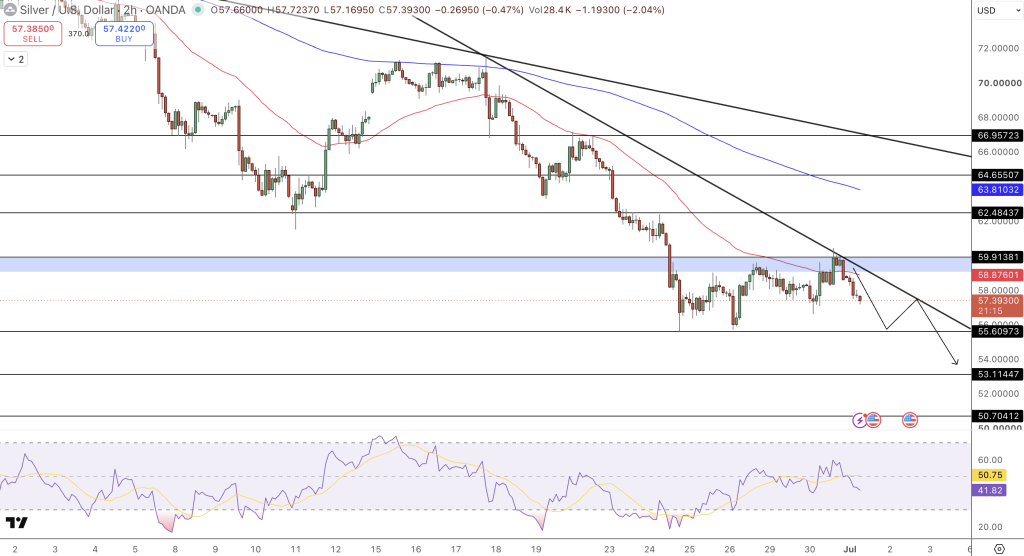
The pair remains inside the descending channel with a major black resistance resistance line trend line above near the historical $72+ price highs in the chart as well as below the major black trend support lines with multiple lower moving averages such as the 4H 200SMA at $69.68.
On indicators, the RSI is at a neutral 14-period reading at 50.75, indicating seller dominance continues for now and a secondary leg lower remains available until oversold conditions set in. A red MACD histogram remains below the 0 line indicating the current bearishness continues. In addition, there are lower low wicks at a low of $56.61 indicating initial bids at the support level near $55.63, the lowest 2026 low.
Silver Summary And Trade Idea
Macro news has caused silver to fall as a war premium receded and the US Federal Reserve, currently under leadership of new Chair Kevin Warsh, keeps interest rates elevated for longer. A silver spot price deficit forecast of 46.3 million troy ounces should help silver recover over the longer run, but the continuation breakdown below the rising blue trendline support line suggests silver rallies are not likely to hold higher levels and could face a sell-off to old resistance support lines.
Tactical Continuation Trade
Continue selling spot silver price on any weak technical rally to the breakdown support of the blue trendline at $59.06, place a sell stop-loss order on the trade above the recent local high near $61.55, and target a continuation trade below the initial horizontal support zone at $56.61 down to the 2026 low at $55.63, before targeting an extended move lower into the broad support zone near $50.70.
- Check out our free forex signals
- Follow the top economic events on FX Leaders economic calendar
- Trade better, discover more Forex Trading Strategies
- Open a FREE Trading Account
- Read our latest reviews on: Avatrade, Exness, HFM and XM
Related Articles
Sidebar rates
Related Posts
Ava

