Buying AUD/USD at the 100 SMA
AUD/USD has retreated back down and it's trying to decide at the 50 SMA now
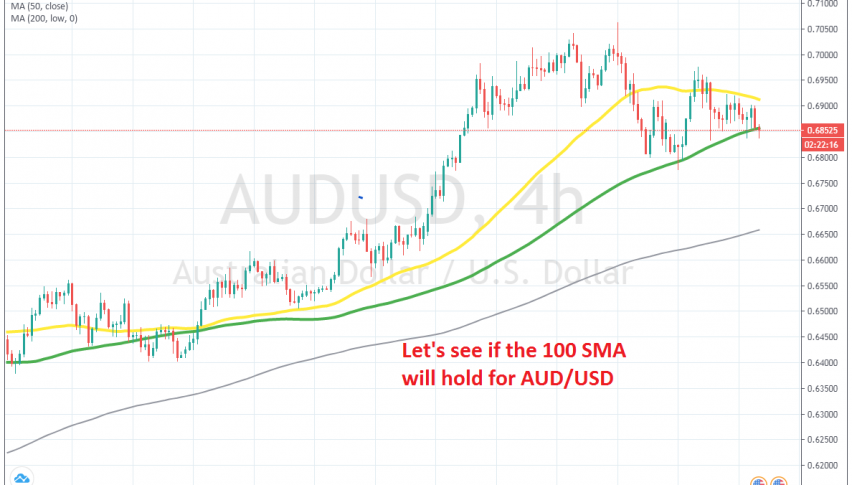
[[AUD/USD]] has been the most bullish among major currencies, climbing more than 12 cents higher and claiming all the losses from the first two weeks of March when risk assets tumbled lower. The other currencies haven’t recuperated all the losses from back then.
AUD/USD climbed above the 70 level earlier this month, reaching 0.7060s. But, the climb ended and this pair retreaded back down, falling nearly 300 pips. Sellers broke the 50 SMA (yellow) on the H4 chart, but the 100 SMA (green) held pretty well as support.
AUD/USD bounced off that moving average and pierced the 50 SMA again, but buyers were not able to break the 50 SMA this time. The price formed a doji candlestick on this time-frame, which is a bearish reversing signal and turned down again. Now, AUD/USD is back at the 100 SMA where we decided to go long, hoping for another bounce higher soon.
- Check out our free forex signals
- Follow the top economic events on FX Leaders economic calendar
- Trade better, discover more Forex Trading Strategies
- Open a FREE Trading Account
- Read our latest reviews on: Avatrade, Exness, HFM and XM
Related Articles


Sidebar rates
Related Posts
