Prices Forecast: Technical Analysis
For today, IOTA is predicted to close at approximately $0.0375, with a range between $0.0360 and $0.0390. Looking ahead to the week, the expected closing price is around $0.0380, with a potential range of $0.0365 to $0.0395. The technical indicators suggest a bearish trend, as the RSI is currently at 34.691, indicating oversold conditions. The ATR of 0.0027 suggests low volatility, which may limit significant price movements in the short term. The pivot point is at $0.040, and since IOTA is trading below this level, it reinforces the bearish sentiment. Resistance levels at $0.040 may act as a barrier for upward movement, while support at $0.036 could provide a floor for prices. The market sentiment is cautious, with investors likely to wait for clearer signals before making significant moves. Overall, the combination of technical indicators and market conditions suggests a continued struggle for IOTA to regain upward momentum.
Fundamental Overview and Analysis
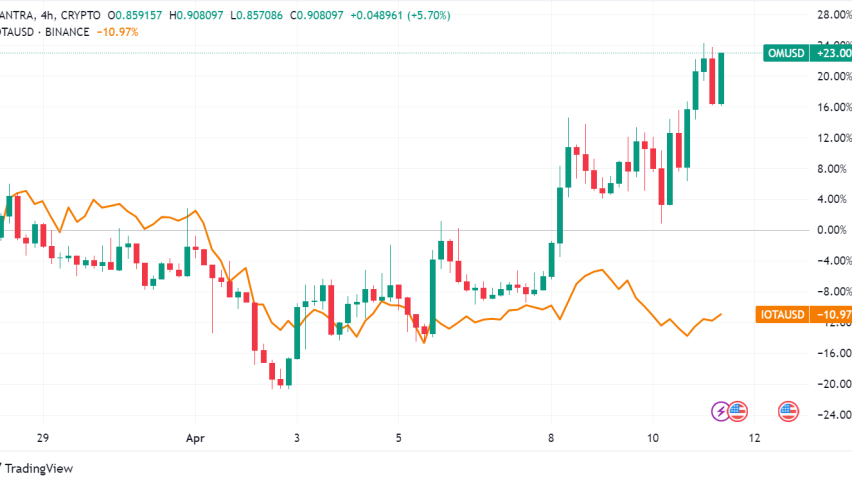
IOTA has experienced a significant decline in recent months, with the price dropping from highs of around $0.1127 to the current level of $0.0379. This decline can be attributed to a combination of market volatility and investor sentiment shifting towards more established cryptocurrencies. Factors influencing IOTA’s value include its unique technology aimed at enabling machine-to-machine transactions and the growing interest in the Internet of Things (IoT). However, competition from other blockchain projects and regulatory uncertainties pose risks to its adoption and scalability. Investor sentiment appears mixed, with some viewing the current price as a buying opportunity, while others remain cautious due to the asset’s recent performance. The current valuation suggests that IOTA may be undervalued compared to its potential, but the path to recovery will depend on broader market trends and technological advancements.
Outlook for IOTA
The future outlook for IOTA remains uncertain, with current market trends indicating a potential for gradual recovery if positive developments occur. In the short term (1 to 6 months), IOTA may experience fluctuations within the $0.036 to $0.040 range, influenced by market sentiment and broader economic conditions. Long-term projections (1 to 5 years) suggest that if IOTA can successfully capitalize on its technological advantages and expand its use cases, it could see significant price appreciation. However, external factors such as regulatory changes and competition will play a crucial role in shaping its future. Investors should remain vigilant about market dynamics and be prepared for potential volatility. Overall, while there are opportunities for growth, the risks associated with IOTA’s market position cannot be overlooked.
Technical Analysis
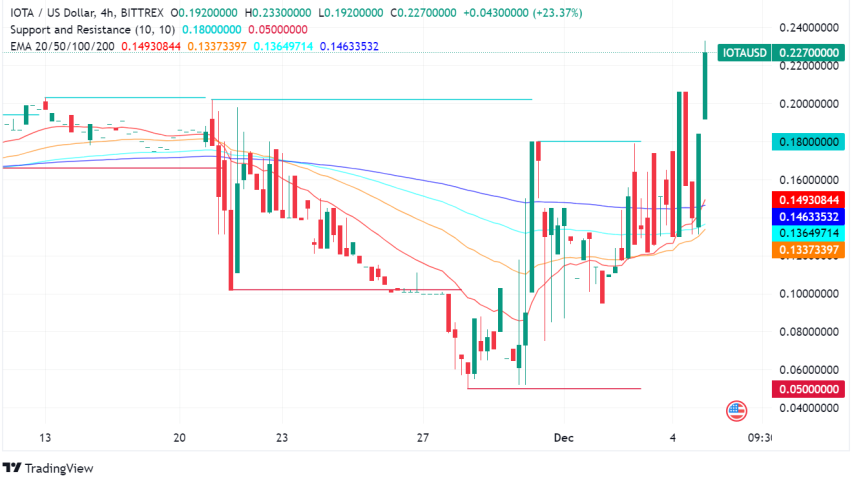
Current Price Overview: The current price of IOTA is $0.0379, which is slightly lower than the previous close of $0.0384. Over the last 24 hours, the price has shown a slight downward trend with low volatility, indicating a lack of strong buying or selling pressure. Support and Resistance Levels: Key support levels are at $0.036, $0.035, and $0.034, while resistance levels are at $0.040, $0.041, and $0.042. The pivot point is at $0.040, and since IOTA is trading below this level, it suggests a bearish outlook. Technical Indicators Analysis: The RSI is at 34.691, indicating oversold conditions and a potential for a bullish reversal if buying interest increases. The ATR of 0.0027 suggests low volatility, while the ADX at 24.531 indicates a strengthening trend. The 50-day SMA is at $0.0496, and the 200-day EMA is at $0.0544, showing no crossover yet, which suggests a continuation of the current trend. Market Sentiment & Outlook: The sentiment is currently bearish, as indicated by the price action below the pivot point and the RSI suggesting oversold conditions. The ADX indicates a strengthening trend, which could lead to a potential reversal if buying pressure increases.
Forecasting Returns: $1,000 Across Market Conditions
The table below outlines potential investment scenarios for IOTA, providing insights into expected price changes and estimated returns based on different market conditions.
| Scenario | Price Change | Value After 1 Month |
|---|---|---|
| Bullish Breakout | +10% to ~$0.0417 | ~$1,100 |
| Sideways Range | 0% to ~$0.0379 | ~$1,000 |
| Bearish Dip | -10% to ~$0.0341 | ~$900 |
FAQs
What are the predicted price forecasts for the asset?
The predicted daily closing price for IOTA is approximately $0.0375, with a weekly forecast of around $0.0380. The price is expected to range between $0.0360 and $0.0390 for today and $0.0365 to $0.0395 for the week.
What are the key support and resistance levels for the asset?
Key support levels for IOTA are at $0.036, $0.035, and $0.034. Resistance levels are at $0.040, $0.041, and $0.042, with the pivot point at $0.040 indicating a bearish sentiment as the price is currently below this level.
What are the main factors influencing the asset’s price?
IOTA’s price is influenced by its unique technology for machine-to-machine transactions, competition from other cryptocurrencies, and regulatory uncertainties. Market sentiment and broader economic conditions also play a significant role in shaping its value.
What is the outlook for the asset in the next 1 to 6 months?
In the short term, IOTA is expected to fluctuate within the $0.036 to $0.040 range, influenced by market sentiment and economic conditions. The long-term outlook will depend on IOTA’s ability to capitalize on its technological advantages and expand its use cases.
What are the risks and challenges facing the asset?
IOTA faces risks such as competition from other blockchain projects, market volatility, and regulatory hurdles. These challenges could impact its adoption and scalability, affecting its long-term growth potential.
Disclaimer
In conclusion, while the analysis provides a structured outlook on the asset’s potential price movements, it is essential to remember that financial markets are inherently unpredictable. Conducting thorough research and staying informed about market trends and economic indicators is crucial for making informed investment decisions.