Prices Forecast: Technical Analysis
For yearn.finance, the predicted daily closing price is $1,650, with a range of $1,600 to $1,700. Over the week, we anticipate a closing price of $1,700, with a range between $1,650 and $1,750. The technical indicators suggest a bearish trend, as the RSI is currently at 26.6179, indicating oversold conditions. The ATR of 100.2486 suggests moderate volatility, which could lead to price fluctuations within the predicted range. The pivot point at $1,657.53 indicates that the asset is currently trading below this level, reinforcing the bearish sentiment. Resistance levels at $1,710.45 and $1,776.55 may act as barriers to upward movement, while support levels at $1,591.43 and $1,538.51 could provide downside protection. The market’s reaction to upcoming economic data, particularly the Michigan Consumer Sentiment index, could further influence price movements. Overall, traders should be cautious and consider potential short positions if the price fails to break above resistance levels.
Fundamental Overview and Analysis
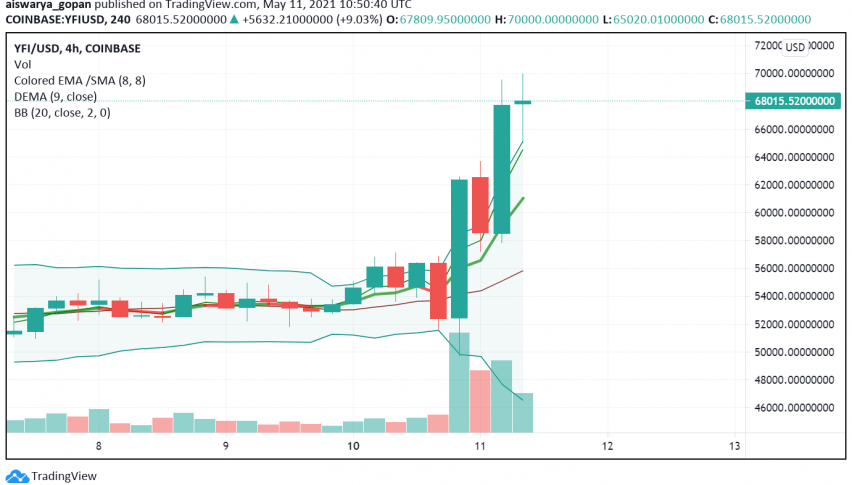
Recently, yearn.finance has experienced significant price volatility, reflecting broader market trends and investor sentiment. Factors influencing its value include the ongoing developments in decentralized finance (DeFi) and the overall cryptocurrency market dynamics. Investor sentiment appears cautious, with many participants awaiting clearer signals from economic indicators and regulatory developments. The recent goods trade balance data from the U.S. may impact market sentiment, as a widening trade deficit could lead to a weaker dollar, potentially benefiting crypto assets. Opportunities for growth remain, particularly as DeFi continues to gain traction and attract new users. However, risks such as regulatory scrutiny and competition from other DeFi platforms could hinder its performance. Currently, yearn.finance appears undervalued compared to its historical highs, suggesting potential for recovery if market conditions improve.
Outlook for yearn.finance
The future outlook for yearn.finance remains cautiously optimistic, with potential for recovery in the coming months. Current market trends indicate a bearish sentiment, but a shift in economic conditions could lead to a bullish reversal. In the short term (1 to 6 months), we expect price movements to remain volatile, with potential for a gradual recovery if resistance levels are breached. Long-term (1 to 5 years), the asset could see significant growth as DeFi adoption increases and new use cases emerge. However, external factors such as regulatory changes and market crashes could pose risks to this outlook. Investors should monitor economic indicators closely, as they could significantly impact price movements. Overall, while challenges exist, the potential for yearn.finance to capitalize on the growing DeFi market remains strong.
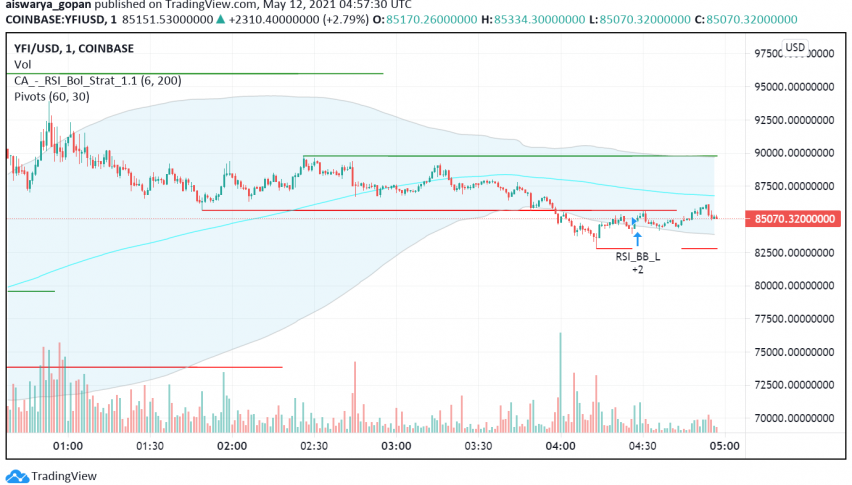
Technical Analysis
Current Price Overview: The current price of yearn.finance is $1,644.35, which is a decrease from the previous close of $1,650. Over the last 24 hours, the price has shown a slight downward trend with moderate volatility, indicating a bearish sentiment. Support and Resistance Levels: Key support levels are at $1,591.43, $1,538.51, and $1,472.41, while resistance levels are at $1,710.45, $1,776.55, and $1,829.47. The pivot point is $1,657.53, and since the price is currently below this level, it suggests a bearish outlook. Technical Indicators Analysis: The RSI is at 26.6179, indicating oversold conditions and a potential for a bullish reversal if buying pressure increases. The ATR of 100.2486 suggests moderate volatility, while the ADX at 32.4577 indicates a strong trend. The 50-day SMA and 200-day EMA are not currently crossing, suggesting a continuation of the bearish trend. Market Sentiment & Outlook: Sentiment is currently bearish, as indicated by the price action below the pivot point, the low RSI, and the lack of a moving average crossover.
Forecasting Returns: $1,000 Across Market Conditions
The table below outlines potential investment scenarios for yearn.finance, providing insights into expected price changes and estimated returns on a $1,000 investment.
| Scenario | Price Change | Value After 1 Month |
|---|---|---|
| Bullish Breakout | +10% to ~$1,810 | ~$1,100 |
| Sideways Range | 0% to ~$1,644 | ~$1,000 |
| Bearish Dip | -10% to ~$1,480 | ~$900 |
FAQs
What are the predicted price forecasts for the asset?
The predicted daily closing price for yearn.finance is $1,650, with a weekly forecast of $1,700. The price is expected to fluctuate between $1,600 and $1,700 daily, and $1,650 to $1,750 weekly.
What are the key support and resistance levels for the asset?
Key support levels for yearn.finance are at $1,591.43, $1,538.51, and $1,472.41. Resistance levels are at $1,710.45, $1,776.55, and $1,829.47, with a pivot point at $1,657.53.
What are the main factors influencing the asset’s price?
The asset’s price is influenced by market sentiment, economic indicators, and developments in the DeFi space. Regulatory changes and competition from other platforms also play significant roles.
What is the outlook for the asset in the next 1 to 6 months?
In the short term, yearn.finance is expected to experience volatility with potential for recovery if resistance levels are breached. Long-term growth is anticipated as DeFi adoption increases.
What are the risks and challenges facing the asset?
Risks include regulatory scrutiny, market volatility, and competition from other DeFi platforms. These factors could hinder growth and impact investor sentiment.
Disclaimer
In conclusion, while the analysis provides a structured outlook on the asset’s potential price movements, it is essential to remember that financial markets are inherently unpredictable. Conducting thorough research and staying informed about market trends and economic indicators is crucial for making informed investment decisions.