Prices Forecast: Technical Analysis
For today, the predicted closing price for GBP/JPY is 215.50, with a range of 215.15 to 215.69. Looking ahead to the week, the forecasted closing price is 216.00, with a range of 215.50 to 216.50. The technical indicators suggest a bullish sentiment, with the RSI at 60.24 indicating upward momentum. The ATR of 1.2814 suggests moderate volatility, which could lead to price fluctuations within the predicted ranges. The pivot point at 215.53 indicates that the price is currently trading just above this level, reinforcing the bullish outlook. Resistance levels at 215.69 and 215.80 may act as barriers to further upward movement, while support levels at 215.42 and 215.27 provide a safety net for potential dips. Overall, the combination of these indicators suggests that GBP/JPY may continue to trend higher, barring any significant negative news.
Fundamental Overview and Analysis
GBP/JPY has shown a strong upward trend recently, closing at 215.572, reflecting positive investor sentiment. Factors influencing this asset include the Bank of England’s monetary policy and Japan’s economic indicators, particularly consumer confidence, which is forecasted to decline. Market participants are optimistic about the GBP due to potential interest rate hikes, while the JPY faces pressure from weak economic data. The current valuation of GBP/JPY appears to be fairly priced, considering the recent price movements and economic forecasts. However, risks such as geopolitical tensions and market volatility could impact future performance. Investors should remain cautious and monitor economic indicators closely, as these will significantly influence the asset’s value.
Outlook for GBP/JPY
The future outlook for GBP/JPY remains positive, with expectations of continued upward movement in the short term. Current market trends indicate a bullish sentiment, supported by historical price movements and a favorable economic environment. In the next 1 to 6 months, we anticipate a price range of 215.50 to 220.00, driven by potential interest rate adjustments by the Bank of England. Long-term forecasts suggest that GBP/JPY could reach 225.00 to 230.00 over the next 1 to 5 years, assuming stable economic growth and favorable market conditions. However, external factors such as geopolitical events or significant economic downturns could alter this trajectory. Investors should stay informed about market developments to capitalize on potential growth opportunities.
Technical Analysis
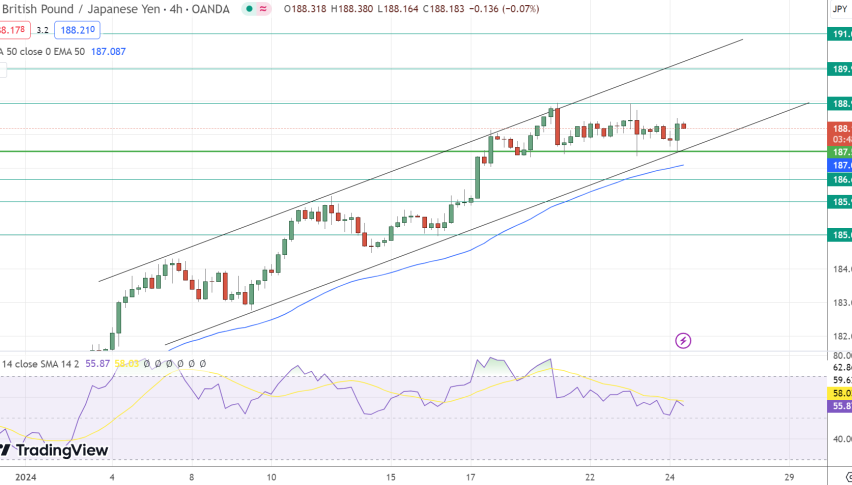
Current Price Overview: The current price of GBP/JPY is 215.572, which is slightly above the previous close of 215.544. Over the last 24 hours, the price has shown a bullish trend with moderate volatility, indicating a strong buying interest. Support and Resistance Levels: Key support levels are at 215.42, 215.27, and 215.15, while resistance levels are at 215.69, 215.80, and 215.95. The pivot point is at 215.53, and since the price is trading above this level, it suggests a bullish sentiment. Technical Indicators Analysis: The RSI is at 60.24, indicating a bullish trend. The ATR of 1.2814 suggests moderate volatility, while the ADX is at 11.9928, indicating a weak trend strength. The 50-day SMA is at 214.153, and the 200-day EMA is at 213.0935, showing no crossover but indicating a bullish bias. Market Sentiment & Outlook: Overall sentiment is bullish, supported by price action above the pivot point, a rising RSI, and stable moving averages.
Forecasting Returns: $1,000 Across Market Conditions
The table below outlines potential investment scenarios for GBP/JPY, providing insights into expected price changes and estimated returns.
| Scenario | Price Change | Value After 1 Month |
|---|---|---|
| Bullish Breakout | +10% to ~$236.13 | ~$1,100 |
| Sideways Range | 0% to ~$215.57 | ~$1,000 |
| Bearish Dip | -5% to ~$204.79 | ~$950 |
FAQs
What are the predicted price forecasts for the asset?
The predicted daily closing price for GBP/JPY is 215.50, with a weekly forecast of 216.00. The price is expected to range between 215.15 and 215.69 today.
What are the key support and resistance levels for the asset?
Key support levels for GBP/JPY are at 215.42, 215.27, and 215.15. Resistance levels are at 215.69, 215.80, and 215.95.
What are the main factors influencing the asset’s price?
The asset’s price is influenced by the Bank of England’s monetary policy, Japan’s economic indicators, and overall market sentiment. Recent consumer confidence data from Japan is also a significant factor.
What is the outlook for the asset in the next 1 to 6 months?
The outlook for GBP/JPY in the next 1 to 6 months is positive, with expectations of a price range between 215.50 and 220.00. This is driven by potential interest rate adjustments by the Bank of England.
What are the risks and challenges facing the asset?
Risks include geopolitical tensions, market volatility, and potential economic downturns. These factors could significantly impact the asset’s price and investor sentiment.
Disclaimer
In conclusion, while the analysis provides a structured outlook on the asset’s potential price movements, it is essential to remember that financial markets are inherently unpredictable. Conducting thorough research and staying informed about market trends and economic indicators is crucial for making informed investment decisions.