The Phenomenal US Dollar Dominated the FX Market Today. The Pound is Sitting at a 31-Year Low Against the US Dollar
There has been very little action in the currency market lately. All the major pairs have been trading in ranges, and volatility has been largely subdued. The GBP/USD changed this scenario today when it broke important technical levels and declined to new yearly, and 31-year lows. It is exciting to see a resumption of the large downtrend which began in July 2014. Since then the pair has lost more than 25% of its value. That is about 4450 pips! That’s why we should never make the classic mistake of rookie traders to think that ‘the price will not fall further than it has fallen already’. Remember that the trend is your friend, and trading in the direction of important trends greatly increases your chances of being profitable. Let’s take a look at Cable:
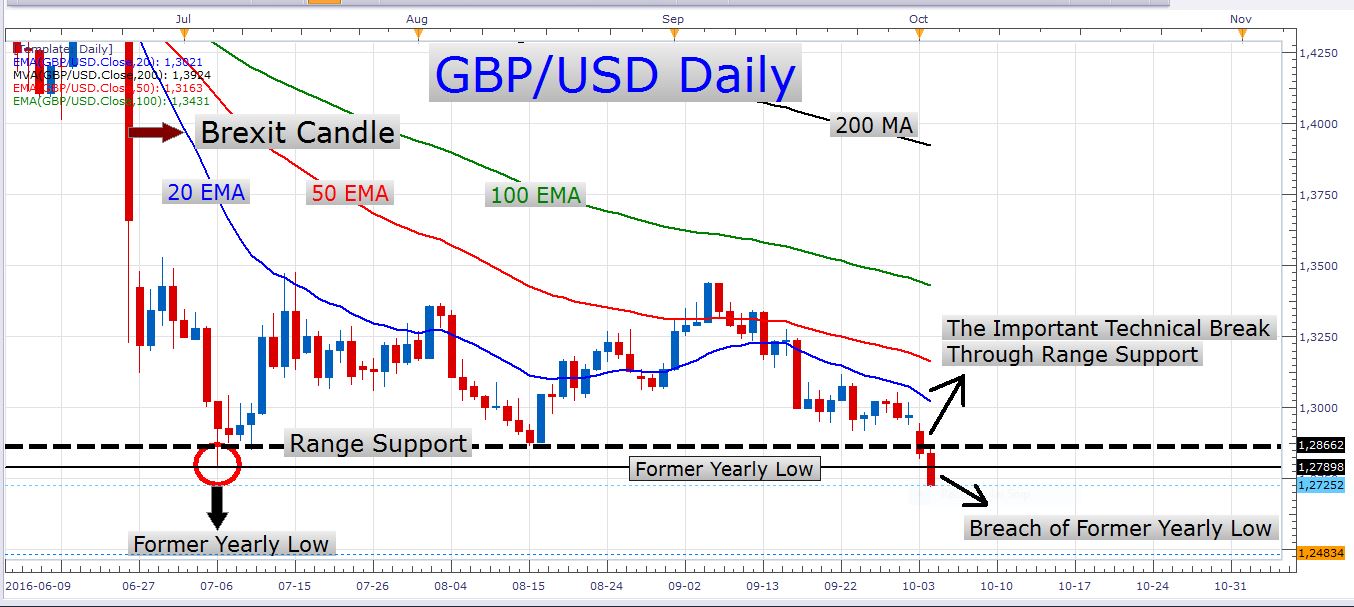
GBP/USD Daily Chart
In yesterday’s article, I mentioned that I would like to see a firm daily close below the important range support level (the dotted line in the chart above). This is exactly what the sellers accomplished today. The pair cleared the former yearly lows and closed well below it, and the range support level. As you can see in this chart, today’s candle barely left a shadow when it closed, that is, it basically closed on the low of the day. When gauging bearish momentum, this type of daily close is what catches my eye. It conveys to us that the bearish market players maintained control of the market until the end of the trading day. Let’s look at how we can take advantage of this fresh pound weakness and US dollar strength:
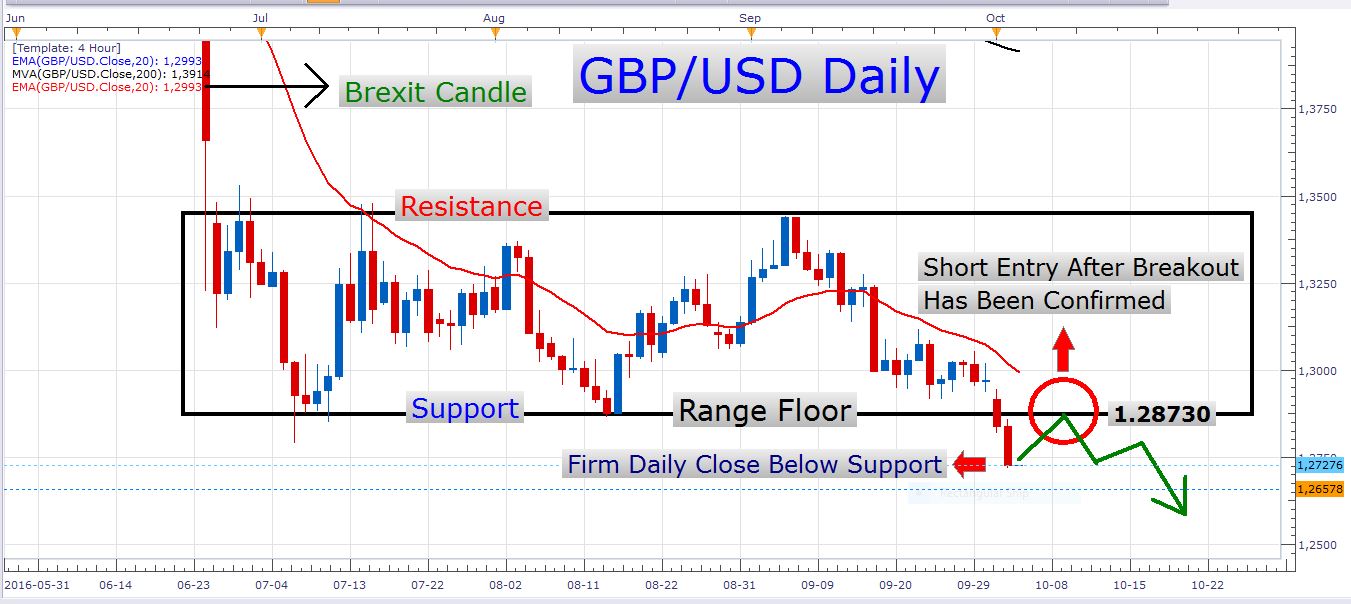
GBP/USD Daily Chart
If you recently read some of my articles you might have encountered this setup already. Something that often happens in the FX market, is that when a major support level is decisively breached, that same support level turns into a resistance zone. Subsequently, there is a high probability trade setup to be found at the retest level of the breakout, after the breakout as occurred. The drawings on the chart above make it simple to understand. Trading this type of setup requires patience, however, and of course the trader needs to be able to endure many disappointments when the price doesn’t retrace far enough to reach his entry order(s). Traders often don’t have the patience and control to wait for perfect (or near-perfect) trade setups. They would rather enter a low probability trade right now than to wait for a great setup which offers a solid opportunity to make money. Much of trading is about mastering yourself. If you can master yourself, you can master the markets.
Of course, the trade setup mentioned above is not the only way to trade Cable. During the last two days, there were numerous opportunities to trade this pair successfully. Look at this 30-minute chart:
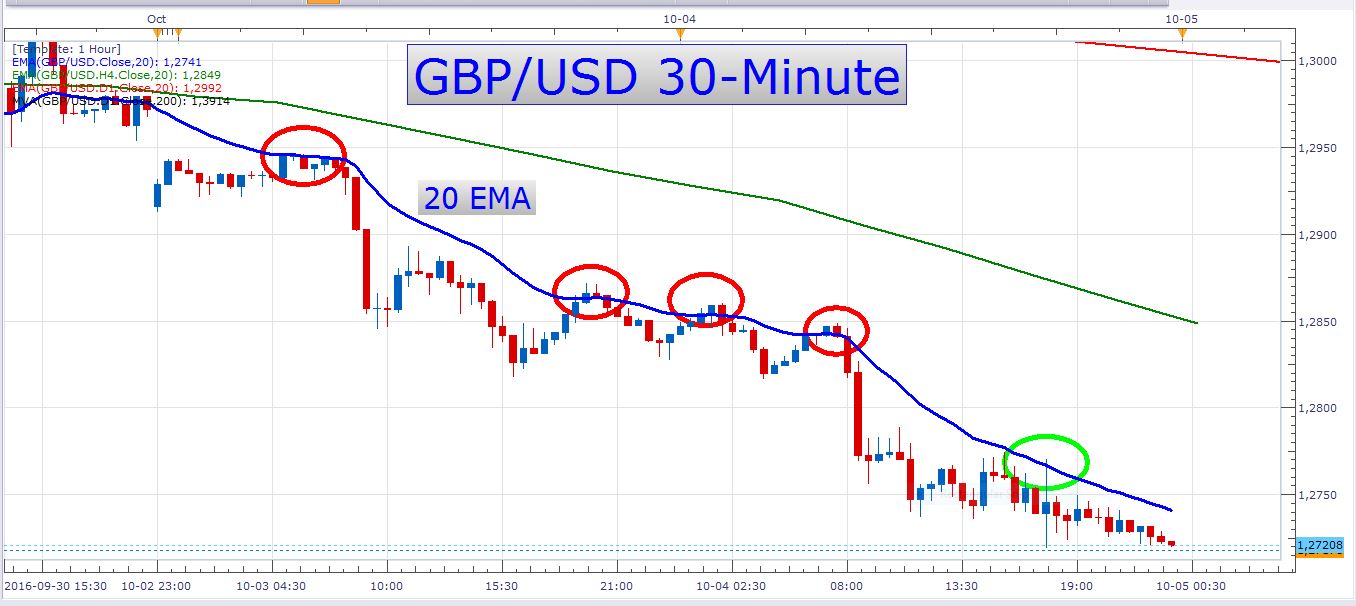
GBP/USD 30-Minute Chart
Pullbacks to the 20-EMA (the blue moving average) have offered many perfect entry points in the last two days. Notice how you could have entered short trades with a tight stop loss at each one of the circles on the chart, and made money out of it. The green circle indicates a profitable entry which could have been taken today in this manner.
USD/JPY
I was personally waiting for the pair to break through the big 100.00 level, and to trade a breakout-retest setup on it (in a similar way to the GBP/USD setup). However, the massive US dollar strength that we encountered today ruffled up my plans a bit. Let’s look at a daily chart:
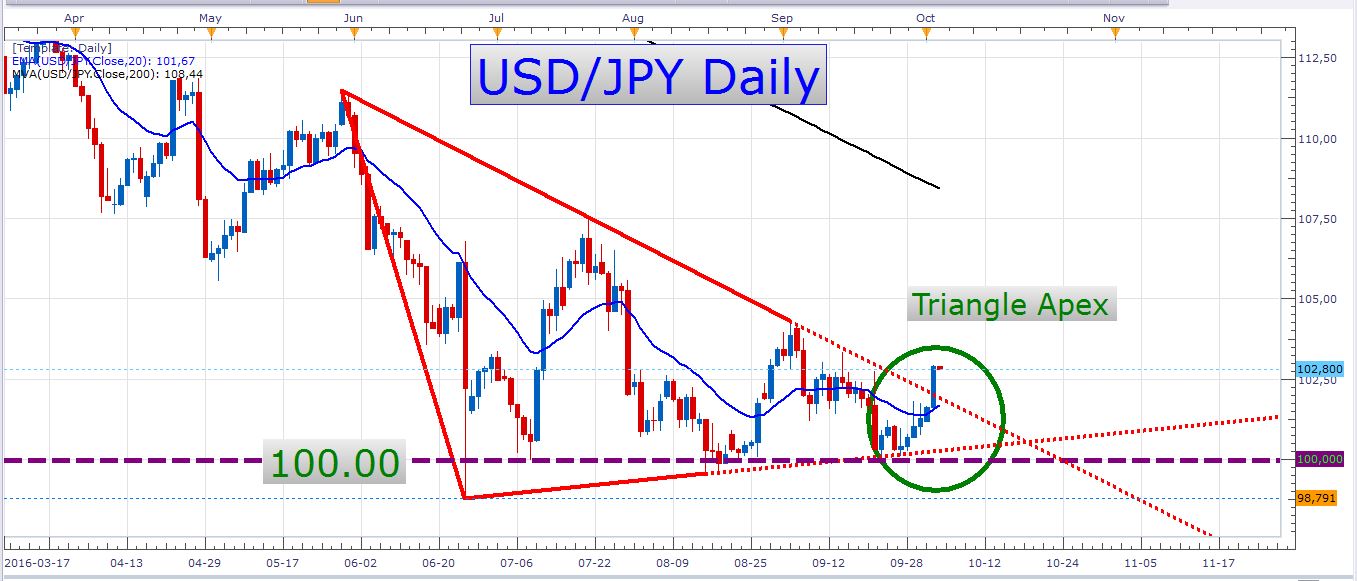
USD/JPY Daily Chart
I would have liked to see a breakout through the base of this triangle, but it looks like this pair has grown very allergic to the big 100 level. I say this because of the many times it bounced off this level, and could not overcome it. The break of this trendline makes me wonder if we haven’t perhaps set an important low near the 100.00 level. There is definitely a very tough area of support over there, and perhaps the bulls will continue to successfully defend this important psychological price level over the next few weeks. For now, the possibility of a break below 100.00 can’t be ruled out, though. The technicals still suggest that we find ourselves in a descending wedge / triangle formation, and until we see a higher high on a daily timeframe, the 100.00 level still remains well in reach.
Economic data releases scheduled for tomorrow
The first important event is the Australian Retail sales at 00:30 GMT. Then we have the UK services PMI at 08:30 GMT. The US ADP Nonfarm employment change numbers will hit the wires at 12:15 GMT, and later in the day we have the US ISM non-manufacturing PMI numbers out at 14:00 GMT. At 14:30 GMT we have the US crude oil inventories numbers which could impact the Canadian dollar of course.
Enjoy your trading day!
- Check out our free forex signals
- Follow the top economic events on FX Leaders economic calendar
- Trade better, discover more Forex Trading Strategies
- Open a FREE Trading Account
- Read our latest reviews on: Avatrade, Exness, HFM and XM
Related Articles


Sidebar rates
Related Posts
