Crude Oil Testing Resistance – Wait For The Sell Signal
Recently, we have not had much luck with crude oil due to its very narrow trading range. It's been consolidating all day and made most of its moves during the US sessions after the release of events.
Now, though it's heading upward, it will encounter an immediate resistance at $46.75. If we zoom out to the 4-hour chart, we can see a symmetric triangle pattern. The good thing is the crude oil has reached below the upper edge of the triangle. This leaves us with two options, either to enter a sell below the trend line resistance at $46.75 with a target of $46.30.
 Crude Oil – 4-Hour Chart
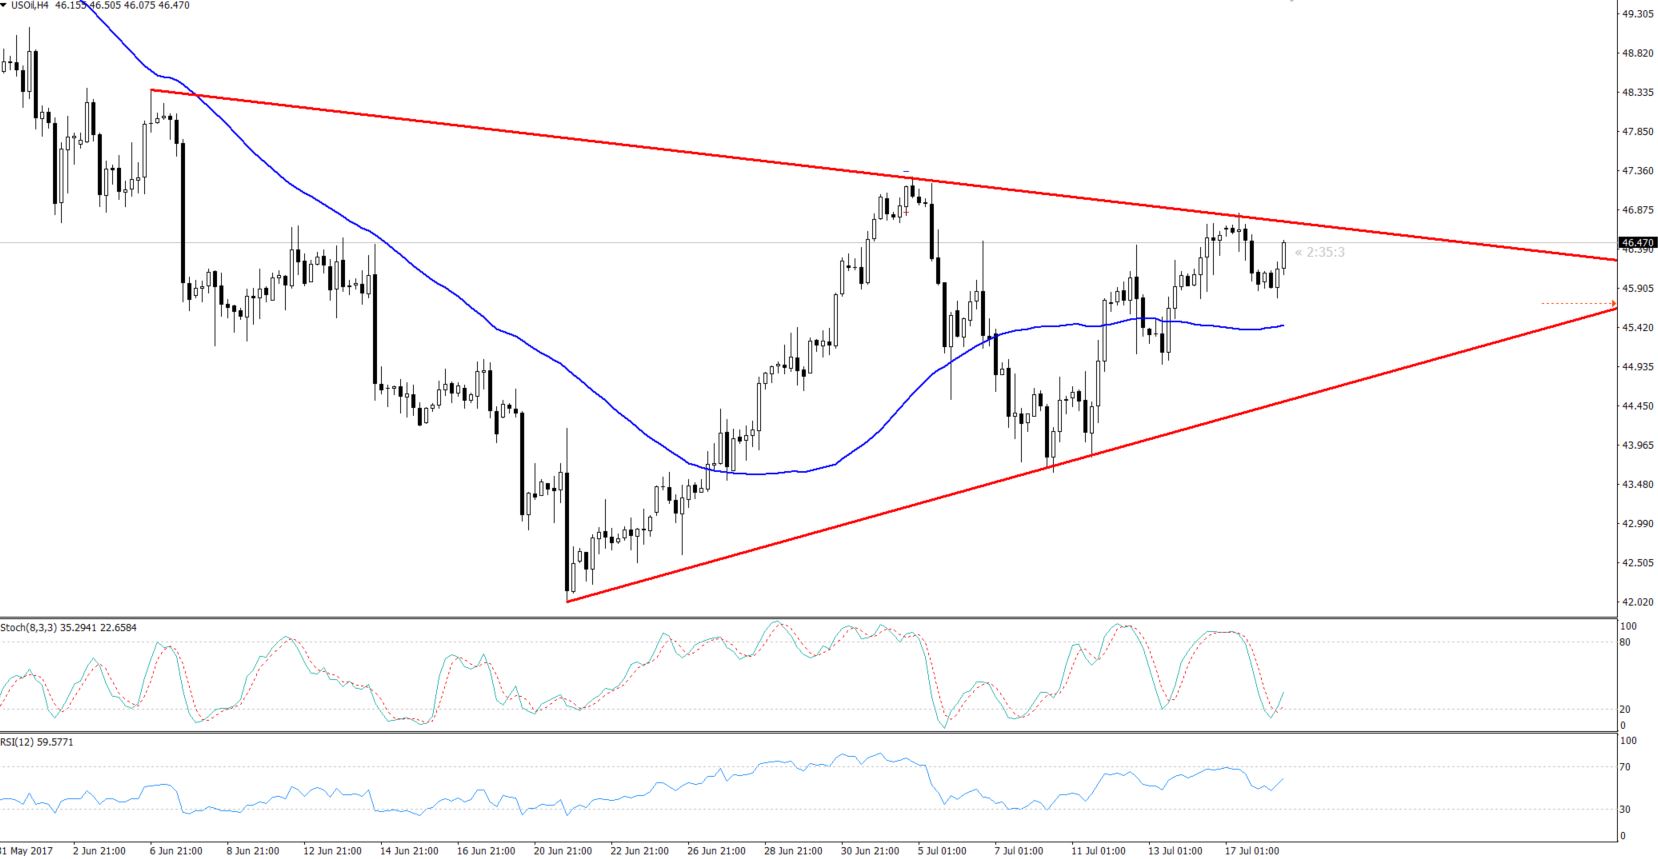
Our second option is to wait to trade for the breakout of $46.75 resistance. Entry right now will be quite risky, as a take profit won't be justified due to a huge stop loss.
Crude Oil – Daily Chart – Symmetric Triangle Pattern
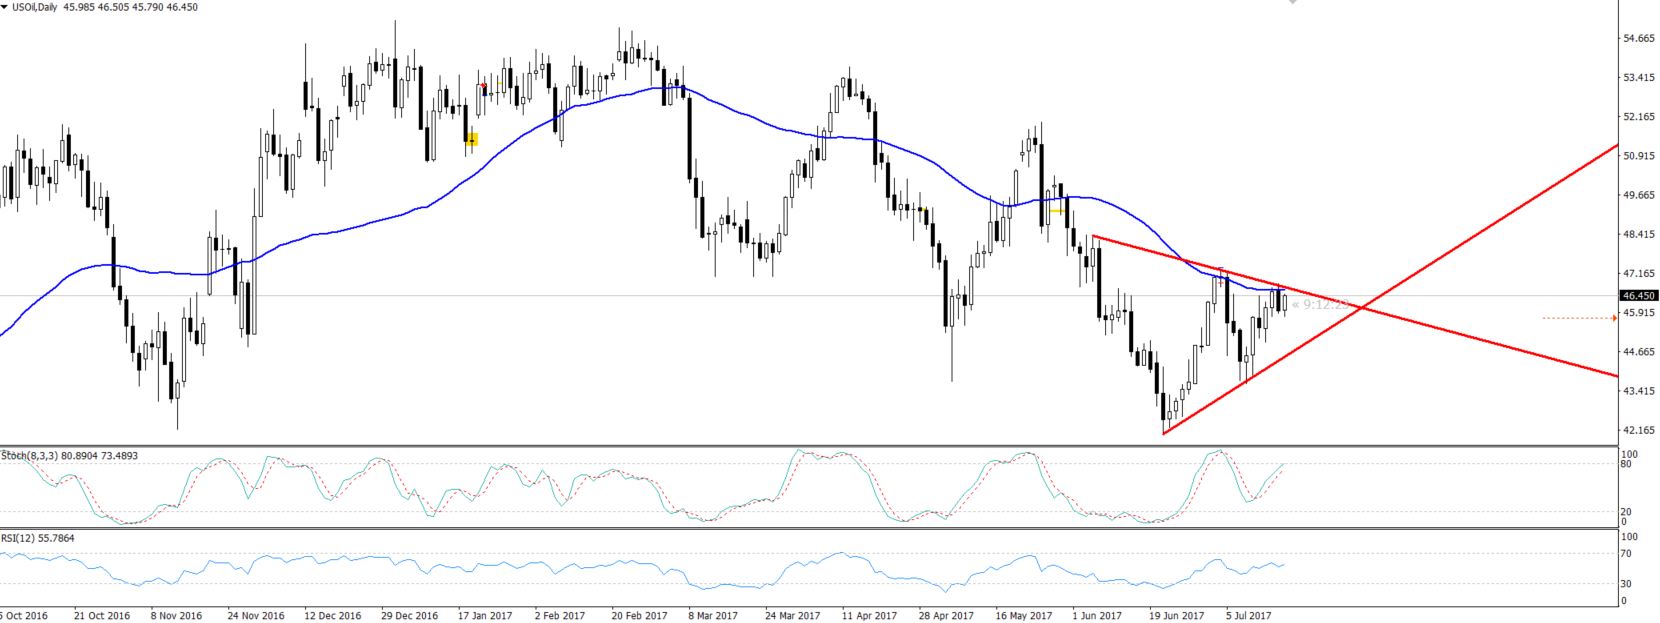
Switching to the daily time frame, the 50-periods EMA is extending a significant resistance at $46.70/75. This is signaling a sell below $46.75 or buy after the breakage of resistance & crossover.
As of now, I'm waiting for $46.75 to enter the market. Perhaps, the signal will be activated during the US session!
- Check out our free forex signals
- Follow the top economic events on FX Leaders economic calendar
- Trade better, discover more Forex Trading Strategies
- Open a FREE Trading Account
- Read our latest reviews on: Avatrade, Exness, HFM and XM
Related Articles


Sidebar rates
Related Posts
