Forex Signals US Session Brief, August 30th – Is This the Day The USD Turns Around?
Truthfully, the USD turn around stared yesterday after the break of 1.20 in EUR/USD. The price triggered a few weak stops above and dived back below it. It hasn’t looked back since, and the situation gets worse in other pairs.
Is this a real turnaround for the USD after months of weakness? We will try to give this question an answer in this midday brief.
 The USD Showing some muscle today
USD Is Fighting for Its Life
The USD has taken a beating since Donald Trump took power in January this year. It has lost 10-15 cents across most of the major currencies during this time. Our hope is that at some point, the sellers will have to call it a day and close their books.
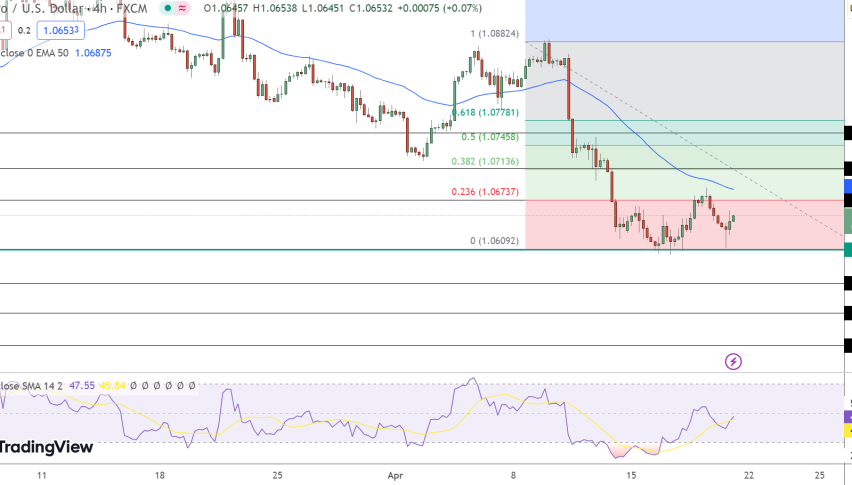
That seems to be happening right now or at least it feels like that. EUR/USD dived back below 1.20 after messing with the stops there and today it even breached 1.19 for a moment. This is the perfect example of how big players chase weak retail stops above a massive level such as 1.20 only to turn around and head the other way afterward.
If you have a look at the EUR/USD daily chart, you can see that the price formed a nice doji yesterday which is a reversal signal. Today’s bearish candlestick is a continuation of this bearish pattern, so the turnaround seems to be forming here.
A similar situation is evolving in USD/JPY, but we didn’t breach any major levels. As we mentioned in the first forex update today, the support area around 108 held the ground once again and now we are 200 pips higher, above 110.
Besides the technical picture, the fundamentals turned bullish again today. The US non-farm employment change came in 50k higher than expectations and last month’s number was revised higher as well. The real surprise came from the Q2 GDP report, which moved to 3% from 2.6% previously. This is another hawkish piece of the puzzle for the FED.
Trades in Sight
Long USD/JPY
- The daily chart is headed up
- The trend has changed after having tried the bottom of the range yesterday
- Stochastic was oversold until yesterday but it has now turned up
- The last 2 weekly candlesticks closed as dojis
- Stochastic is oversold on the weekly chart
The daily chart is clearly pointing up as the price has jumped more than 200 pips in the last couple of days. Although, the weekly chart looks even more bullish. It is well overbought and the 100 SMA (red) provided solid support once again. That makes strong support indicators holding up well around 108. Now, this week’s candlestick looks pretty bullish, especially coming after 2 dojis.
 USD/JPY entered a bullish phase yesterday
Bearish Commodity Block
- The 1.24 support level in USD/CAD held and reversed the price
- The 0.80 resistance in AUD/USD survived as well
- NZD/USD has been bearish despite recent USD weakness
The Canadian Dollar has been running higher, despite signs in the other commodity Dollars that a reverse might be near. The Aussie has failed to make new highs recently, while the Kiwi has actually lost ground in the last couple of weeks. Today though, those signs proved to be correct as the commodity Dollars got smashed, so I´m looking for shorts in Com Dolls.
In Conclusion
Finally, after months of weakness, the USD is back with a vengeance. It is 200 pips higher in some major pairs today, so this really looks like our long awaited reversal.
In this environment, I will be looking to sell the commodity dollars (specifically NZD/USD), but as you know, I like to sell retraces, so I´m waiting for a pullback higher before going short.


