GBP/USD – When Technicals and Fundamentals fall in Line
A few hours ago I was looking at the GBP/USD daily chart and saw that this forex pair was trading around an important indicator. This indic
A few hours ago I was looking at the GBP/USD daily chart and saw that this forex pair was trading around an important indicator. This indicator was the daily 200 SMA (purple) which had acted as resistance in early August.
Besides that, yesterday’s daily candlestick closed as a hammer, which often indicates a trend reversal. Technically, this looked like a bearish setup, but I held back because the daily chart was not overbought yet, with stochastic in the middle of the range and heading up.
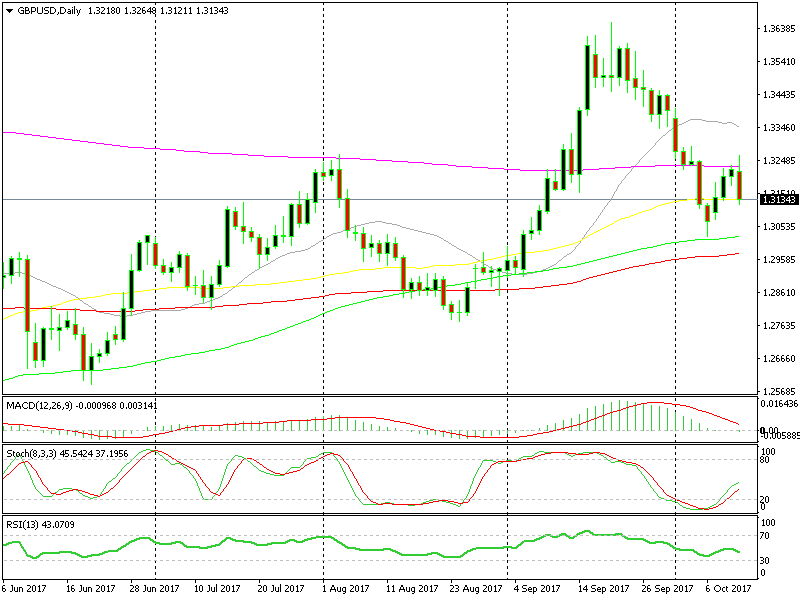 That’s a big bearish candlestick
But, Brexit loomed over our heads again. Barnier and Davis who are the two guys in charge of the EU/UK talks, ignored the comments we’ve been hearing from UK officials this week that UK was going to get a great Brexit deal.
We knew that wasn’t true, but the market and particularly GBP traders faced the harsh reality today as both men in charge said that they were far from a deal. The clock is ticking and the market doesn’t like this one bit. UK businesses surely hate it. Sometimes is better to have a “weak” agreement than none at all, which increases uncertainty immensely for UK businesses.
So, GBP took a nose dive and GBP/USD tumbled 130 pips top to bottom so far. The long term sell trade is still valid though, but I prefer to see a retrace higher first before going all in.
- Check out our free forex signals
- Follow the top economic events on FX Leaders economic calendar
- Trade better, discover more Forex Trading Strategies
- Open a FREE Trading Account
- Read our latest reviews on: Avatrade, Exness, HFM and XM
Related Articles

Sidebar rates
Related Posts
