Bitcoin Trading Between Two Moving Averages
Cryptocurrencies have been on a strong bearish trend in May, but the trend turned bullish last week. Bitcoin and other major cryptos followed an uptrend during the previous week, although the trend wasn’t really strong if you compare it to the downtrend of the previous weeks.
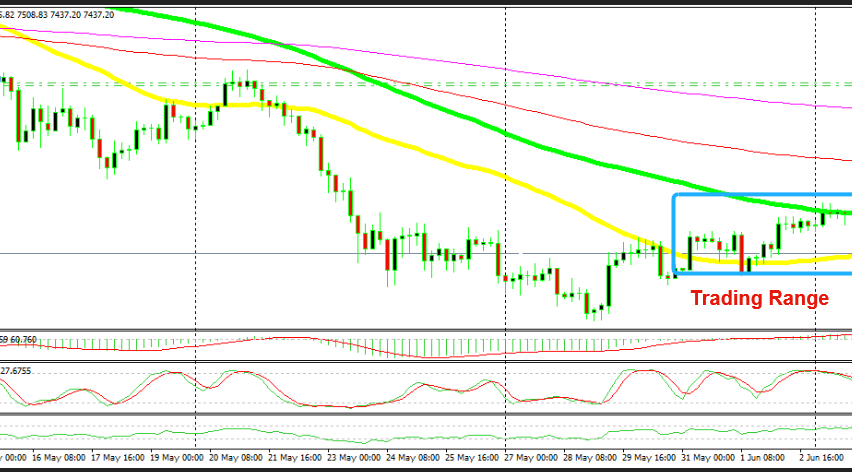
Nonetheless, that uptrend took us from $7,000 to $7,700 and above the 50 SMA (yellow) on the H4 chart. Bitcoin went on to touch the 100 SMA (green). The price pierced that moving average quite a few times, so we can see that it tried to break above the 100 SMA.

The 50 and 100 SMAs are strong support and resistance indicators
The buyers failed to break above it though. The 100 SMA resisted and now we see Bitcoin heading back down to the 50 SMA again. It took a bearish turn last night and at the moment we are just above the 50 SMA.
Now, if the uptrend is to remain intact, the 50 SMA should hold. The stochastic indicator has become oversold so the retrace lower looks complete. This seems like the perfect setup for a buy forex trade. The problem is that last week’s climb, which we consider as an uptrend, might actually be just a pullback of the bigger downtrend.
We can’t know that at the moment. The price might reverse back up, or it might continue further down, judging by how quickly the reverse down has happened. So, all we can do now as forex traders, is to pick a side and play with money management techniques.
If you want to buy here, make sure to place the stop loss below the 50 SMA. If you want to sell, hang on a bit longer and wait for the 50 SMA to break first. If it gets broken, then you can sell the break and place the stop above the 50 SMA.


