Bitcoin Stalls at the 20 SMA on the Monthly Chart
Bitcoin and other major cryptocurrencies have been on a steep downtrend during this year. That downtrend came to a halt below $6,000 in June and Bitcoin started making a bullish turnaround in the last two weeks of July. That looked promising as Bitcoin broke the moving averages one after another on the daily chart.
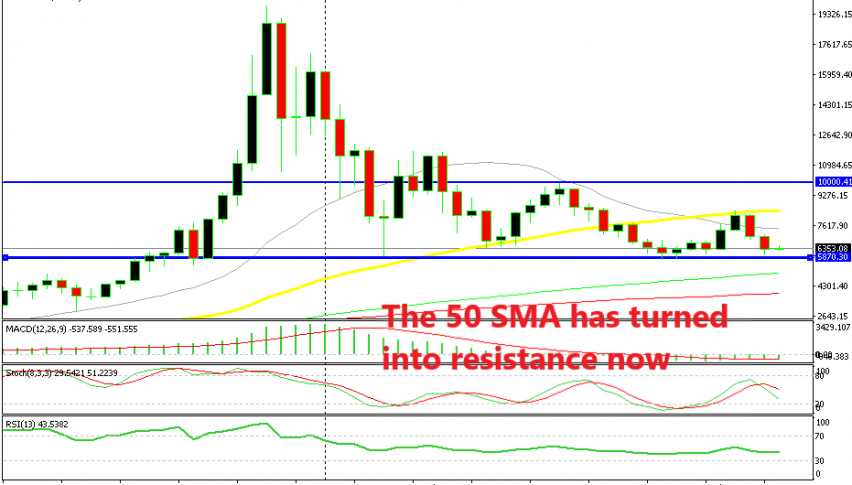
The situation was a bit different on the weekly chart though. On this timeframe chart, the 50 SMA had been providing support a couple of times during the downtrend but eventually, it got broken and it turned into resistance after that.
The buyers couldn’t push above it in July and in August the situation reversed again and Bitcoin resumed the bearish trend. The 50 SMA reversed the price and fundamentals helped the bearish cause as well. The initial public offering from one EFT which was backed by Bitcoin was postponed for September and the sentiment turned negative.

The 20 SMA is providing support
Bitcoin lost around $2,500 during the last two weeks as you can spot from the last two bearish candlesticks, but the decline seems to have stopped now. The decline stopped right above the support level which signals a possible bullish reverse if the support holds.
Looking at the monthly chart, we can see that the 20 SMA (grey) stands right at the support. This will add more strength to this level. We have an open buy position on Bitcoin, so these chart setups look promising for us. Besides that, the stochastic indicator is almost oversold which means that this pair will be oversold soon. We hope that the buyers return and the bullish reverse will come soon.


