EUR/USD Reversing at the 100 Daily SMA Again
EUR/USD has made a decent retrace higher recently but it found resistance at the 100 SMA yesterday on the daily chart
[[EUR/USD]] has been on a bearish trend for a long time, also helped by a weakening Eurozone economy. The price has broken some major levels but it has formed a support area above 1.11 in the last two months. We saw the price bounce off this area again on Friday last week due to some weak US economic data.
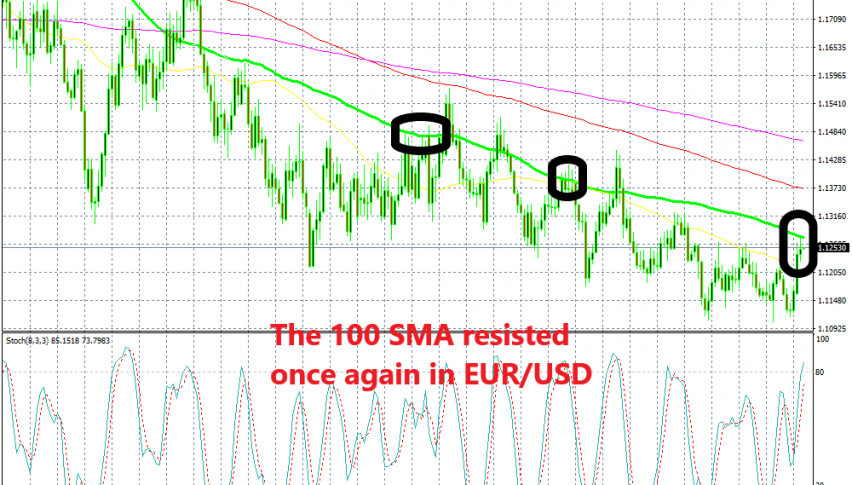
This pair climbed around 50 pips that day and 100 pips on Monday. The climb continued yesterday as well, and the price reached 1.1277 and that’s where the 100 SMA (green) came into play on the daily time-frame. The price just kissed that moving average and it reversed back down.
We have seen all retraces on the daily chart end at moving averages for this pair, either at the 50 SMA (yellow), 100 smooth MA (red) or the 100 simple MA (green). This moving average provided resistance in December last year and again in February this year and it seems like it is doing that one more time now.
Yesterday’s candlestick closed as a doji which is a reversing signal and the stochastic is overbought, so the retrace seems complete and we also got a reversing signal such as the doji. This could be a great opportunity to sell this pair.
- Check out our free forex signals
- Follow the top economic events on FX Leaders economic calendar
- Trade better, discover more Forex Trading Strategies
- Open a FREE Trading Account
- Read our latest reviews on: Avatrade, Exness, HFM and XM
Related Articles


Sidebar rates
Related Posts
