GBP/USD Pierces 1.30 as the 50 SMA Keeps Pushing it Higher
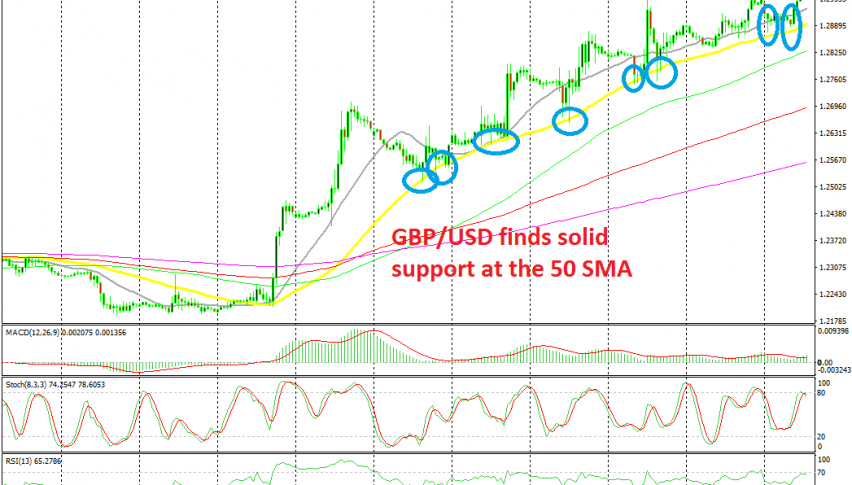
GBP/USD turned really bullish on Thursday 10 days ago. Before that, this pair was trading on a slow bearish trend and the 50 SMA (yellow) was providing resistance during that time. But, the price surged higher and the 50 SMA turned from resistance into support.
Comments regarding a Brexit deal made this pair reverse and since then, the traffic has been one way only. There have been pullbacks as you can see from the H1 chart above, but they have been pretty shallow, and the buyers have returned and pushed the price higher after each pullback was complete on this time-frame chart.
Once the stochastic indicator became oversold or close to it, buyers returned and took things in their hands. The 50 SMA has also been a great support indicator for this pair. It has been holding during retraces lower pretty well. Last night this pair opened with a bearish gap lower and continued to slide, but the price found support at the 50 SMA once again and I decided to go long from there.
The price reversed overnight and hit our TP target, so that trade was successful. Today the price pierced above 1.30 but has returned below that big round level. Although, I will wait for a pullback to the 50 SMA and probably go long from there.


