Bitcoin Being Supported by the 100 SMA
Bitcoin has pulled back from $12,500, but the 100 SMA is holding as support
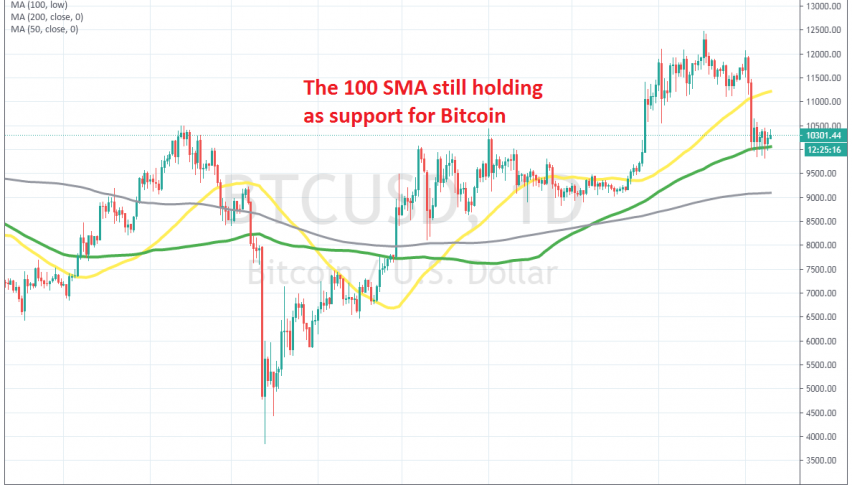
BITCOIN turned bullish in March, after crashing nearly $ 6,000 lower, losing more than half its value, when the markets panicked and the USD surged as a global reserve currency. But the crash had ended by the middle of March, and since then, Bitcoin has been bullish.
The 50 SMA (yellow) turned into resistance for some time on the H4 chart, but it was eventually broken, and buyers pushed higher, above the big round level at $ 10,000, reaching $ 12,500 by the middle of August. But it stopped climbing there.
Then the price started retreating lower, and Bitcoin formed a head and shoulders on the daily time-frame. The 50 SMA was broken, but the 100 SMA (green) turned into support. This moving average has been holding for a week now, despite being pierced a few times. So, this looks like a good chance to go long on Bitcoin, from $ 10,000, which should add more strength to the support. We are following the price action and might go long soon.
- Check out our free forex signals
- Follow the top economic events on FX Leaders economic calendar
- Trade better, discover more Forex Trading Strategies
- Open a FREE Trading Account
- Read our latest reviews on: Avatrade, Exness, HFM and XM
Related Articles


Sidebar rates
Related Posts
