The 100 SMA Continues to Keep Crude Oil Bullish
Crude Oil continues go find solid support at moving averages, which are pushing it up
Crude oil has been bullish since March, when it reversed higher, following the big crash in February and March. The recovery of the Chinese economy last year increased the demand for energy products, which has been keeping crude oil bullish.
We saw a pullback in US WTI Oil in September and October, from $ 43.50 to $ 33, but in November, the bullish trend resumed again after the US elections, and the price broke the previous highs, and eventually buyers pushed above the $ 50 level this month.
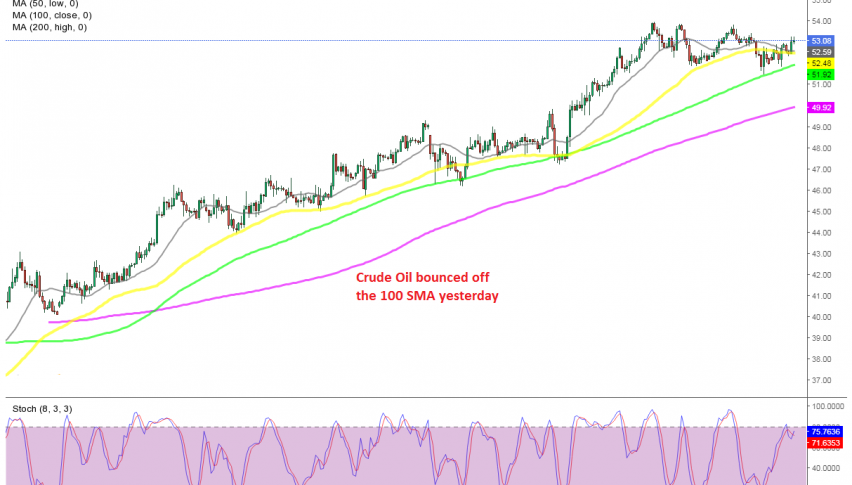
During the last few weeks, moving averages have been doing a great job in providing support on the H4 chart during pullbacks lower. The 20 SMA (gray) and the 50 SMA (yellow) have been acting as support when the trend has been stronger, while the 100 SMA (green) has done so on deeper retraces.
These moving averages held as support on a couple of occasions in December and again in the last few days. So, the bullish trend continues in crude oil and we will try to buy retraces lower at the 100 SMA, particularly if we get a bullish reversing signal down there. But first, we have to wait until that happens, because the buyers remain in control.
- Check out our free forex signals
- Follow the top economic events on FX Leaders economic calendar
- Trade better, discover more Forex Trading Strategies
- Open a FREE Trading Account
- Read our latest reviews on: Avatrade, Exness, HFM and XM
Related Articles


Sidebar rates
Related Posts
