Looking to Sell the Retrace in Gold, After the US GDP and Employment Reports
The Q2 GDP was revised higher in the US today, but unemployment claims jumped as well
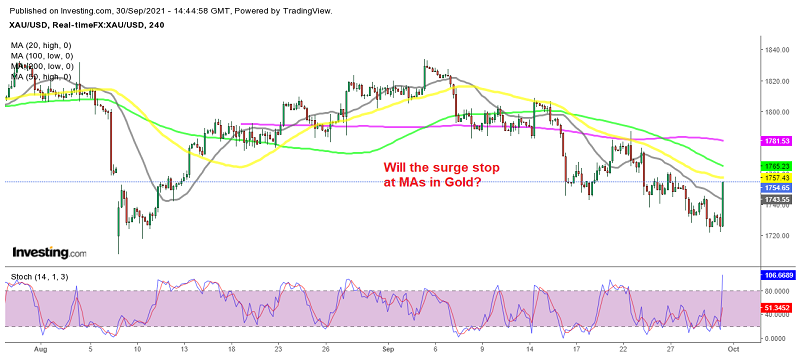
Gold has been extremely volatile in recent months, initially crashing $150 in August, then climbing up and making up for all the losses until September, while this month it has turned bearish again. The uncertainty in the crypto market has been driving safe havens up and down, so Gold has just been riding the waves in the market sentiment.
Today we are seeing a strong bullish move in GOLD , especially after the economic data from the US, which was released a while ago. The final GDP reading for Q2 ticked higher to 6.7% from 6.6% previously, but unemployment claims also increased to 355K. The Q2 GDP is a long was back now, so unemployment claims matter more. The jump has increased the uncertainty and Gold has been bouncing higher but we’re preparing to sell at MAs above around $1,760-$1,765.
The Final Q2 GDP Report
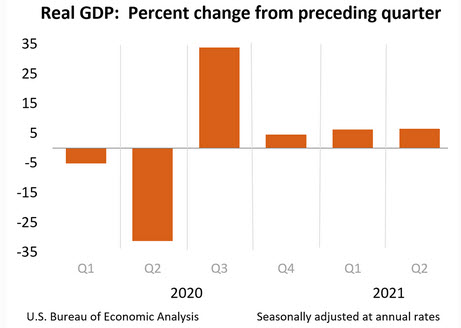
- Q2 GDP (third/final reading) 6.7% vs 6.6% expected
- The advance reading on Q2 was 6.5%
- The second reading was 6.6%
- Q1 GDP was 6.4% annualized
- 2020 GDP was -3.4%
- Personal consumption +% vs +11.9% second reading
- GDP price index +6.2% vs +6.1% second reading
- Core PCE +6.1% vs +6.1% expected
- GDP final sales +8.1% vs +7.9% second reading
The first look at Q3 GDP will be released at the end of October. We get the latest PCE data tomorrow.
Details:
- Inventories cut 1.26 pp from GDP vs -1.30 pp in second reading
- Inventories cut -2.62 pp in Q1
- Business investment 9.2% vs 9.3% second reading
- Business investment in equipment +12.1% vs +11.6% second reading
- Exports +7.6% vs +6.6% second reading
- Imports +7.1% vs +6.7% second reading
- Trade was a 0.18 pp drag vs -0.24 pp in second reading
- Home investment -11.7% vs -11.5% second reading
- Consumer spending on durables +11.6% vs +11.3% second reading
- Personal consumption to pp GDP added 7.92 pp to GDP
- Government spending cut 0.36 pp vs -0.33 pp in second reading
- Full report
The improvement in trade was largely behind the upward revision to the data.
US initial jobless claims and continuing claims for the current week
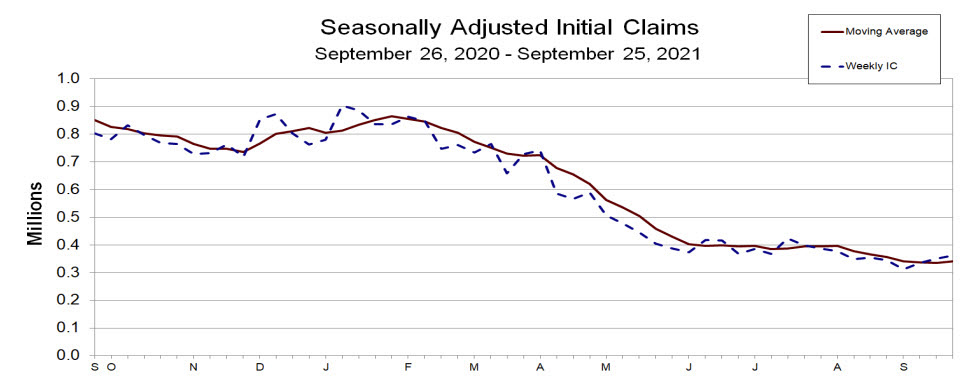
- Initial jobs claims 362K versus 333K estimate
- Prior week 351K (no revision)
- Initial jobless claims 362K versus 333K estimate
- 4-week moving average 340K versus 335.75K last week
- Continuing claims 2.802M vs 2.800M estimate
- 4-week moving average of continuing claims 2.797M vs 2.798M last week
- The largest increases in initial claims for the week ending September 18 were in California (+17,218), Virginia (+12,140), Ohio (+4,147), Oregon (+3,413), and Maryland (+2,452),
- The largest decreases were in Louisiana (-6,935), New York (-2,275), Missouri (-1,568), Oklahoma (-1,264), and New Mexico (-1,055).
The claims data shows the second consecutive surprise move back to the upside. Last week the expectations was for 320K (was 335K the week prior) but rose to 351K. This week, the data shows another rise. Nevertheless, the Fed chair has said that we don’t need blockbuster jobs report to continue the track toward taper by the end of the year.
Gold Live Chart
- Check out our free forex signals
- Follow the top economic events on FX Leaders economic calendar
- Trade better, discover more Forex Trading Strategies
- Open a FREE Trading Account
- Read our latest reviews on: Avatrade, Exness, HFM and XM
Related Articles


Sidebar rates
Related Posts
