Ethereum Symmetrical Triangle Breakout – ETH to Head for $1,400
Ethereum has surpassed $1,360 against the US dollar. If there is a clear move over the $1,400 resistance zone, ETH might begin a new rise.
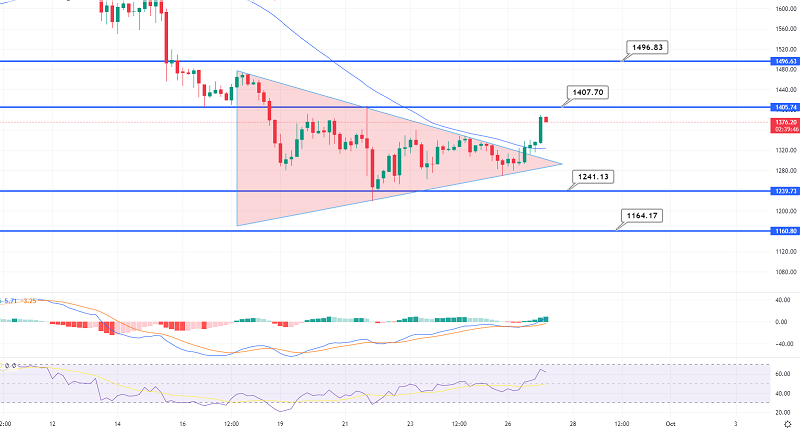
Ethereum has surpassed $1,360 against the US dollar. If there is a clear move over the $1,400 resistance zone, ETH might begin a new rise. Above the $1,320 and $1,350 support levels, ETHEREUM is showing signs of life. The price is currently trading over $1,350, as well as the 100 hourly simple moving average.
On the hourly chart of ETH/USD, there was a break over a key negative trend line with resistance above $1,342. If the pair breaks through the important $1,400 resistance level, it could prolong its advance.
The Ethereum Price is Increasing
At $1,260, Ethereum was able to establish a support base above the $1,260 mark. ETH, like bitcoin, began a steady rise after breaking above the $1,300 resistance level. The price broke through the resistance levels of $1,330 and $1,350 to reach the positive zone. Furthermore, on the hourly chart of ETH/USD, there was a break above a strong negative trend line with resistance above $1,342.
The pair is now trading above the 76.4% Fib retracement level of the bearish move from the swing high of $1,419 to the low of $1,219, which was reached on March 1. The price of ether is also trading over $1,350, as well as the 100 hourly simple moving average. On the upside, the price is encountering resistance at $1,395 and $1,400.
The next significant resistance is $1,420. A clear break above $1,420 might signal the start of a strong rise towards the $1,465 mark. It is close to the 1.236 Fib extension level of the decline from the $1,419 swing high to the $1,219 low. Any additional gains may pave the way for a move towards the $1,500 resistance, above which the bulls may try for $1,580 in the next few sessions.
Dips in ETH Are Limited?
If Ethereum fails to break over the $1,400 barrier level, it may begin a downward trend. On the downside, initial support is nearly $1,350. The next significant support is near $1,320 and the 100 hourly simple moving average.
In the short term, a break below the $1,320 level might push the price towards the $1,250 level of support. If there are any more losses, the price might fall to $1,200.
- Check out our free forex signals
- Follow the top economic events on FX Leaders economic calendar
- Trade better, discover more Forex Trading Strategies
- Open a FREE Trading Account
- Read our latest reviews on: Avatrade, Exness, HFM and XM
Related Articles


Sidebar rates
Related Posts
