 GET ALERTS

 <% signal.analyst %>
<% signal.analyst %>
<% signal.analyst %>

Full access to Signal Reports

About FXLeaders - Real Traders. Real Signals.
At FXLeaders, we are traders first, not just analysts behind a screen. Our mission is to deliver clear, actionable trading signals that make sense in fast-moving markets.| Provider | FXLeaders |
| Website | https://www.fxleaders.com |
| Type | Trading Signals Provider |
| Markets Covered | Forex Crypto Stocks Indices |
| Risk Management Tools | Yes |
| Signal Format | Entry Price Stop Loss Take Profit |
| Signal Delivery | Website Mobile App Telegram |
| Signal Frequency | Daily, 24/7 Signals Feed |
| Copy Trading | Yes |
| Analyst Team | 10+ Full-Time Analysts |
| Support Channel | Telegram Live Support + Analyst Chat |
| Accuracy Monitoring | Live Performance Dashboard |
| Trading Tools | AI-enhanced signals, market commentary |
| Suitable For | Beginners Intermediate Advanced Traders |
| Free Plan Available | Yes |
| Premium Plan | Access to full signal set and faster alerts |
| Platforms | iOS Android Web |
| Location | 🇦🇪 Dubai, UAE |
| Active Users | Over 1 million users in 120+ countries |
| Contact Email | [email protected] |
Signal Types - Quick Overview
| Signal Type | Description |
| Forex | Yes Currency pairs with technical and fundamental input |
| Crypto | Yes Major and trending cryptocurrencies |
| Indices | Yes Global equity indices |
| Stocks | Yes High-volume international stocks |
| Feature | Free Plan |
| Live Forex Signals | Limited |
| Crypto Index Stock Alerts | None |
| Entry SL TP Levels | Yes |
| Telegram Signal Alerts | Yes |
| Signal Support (Telegram) | None |
| Full Performance Access | None |
| Priority Alerts | None |

Our Vision
Our mission is to set the global standard for trusted trading signals, helping millions of traders navigate the markets with confidence, precision, and consistency. Backed by expert analysis and real market experience, we stand with you at every step.Download our app now to get daily forex, crypto, and commodity signals – available on iOS and Android.

Forex Signals April 15: ASML, Bank of America, and Morgan Stanley Earnings Preview Spotlight

Bitcoin Holds Above $74,000 Amid United States–Iran Diplomatic Efforts

Meta Stock Tries to Reclaim Larger Uptrend after Broadcom Partnership

AVGO Stock Soars Toward $400 in After Hours on Broadcom-Meta Deal
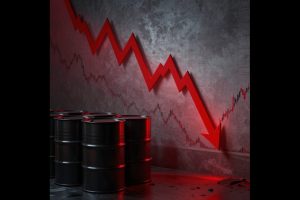
Crude Oil Prices Head Under $90 as Diplomatic Progress Builds
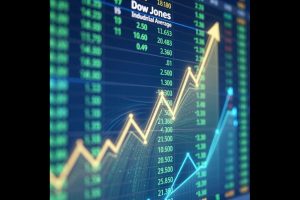
Dow Jones Breaks Resistance, Confirming Uptrend Toward 50K, Nasdaq Composite Soars
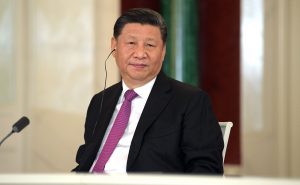
United States Accuses China of Hoarding Oil and Restricting Exports
Long/Short Term Signals
Short-term forex signals are typically traded over periods ranging from around 10 minutes to a few hours. These trades usually aim for gains of approximately 30 to 50 pips, depending on market volatility, and are often closed within the same trading day.
Non-fx Signals
The commodities market is known for its high volatility, with many opportunities to generate profits, as long as you trade carefully. FX Leaders offers signals to trade leading commodities, including crude oil - both US WTI as well as UK Brent, gold, silver, platinum, and palladium. Stay current and find the best trade ideas to make the most from trading commodities with FX Leaders. Cryptocurrencies are one of the latest and fastest emerging groups of instruments to trade, and have turned several early adopters into overnight successes.
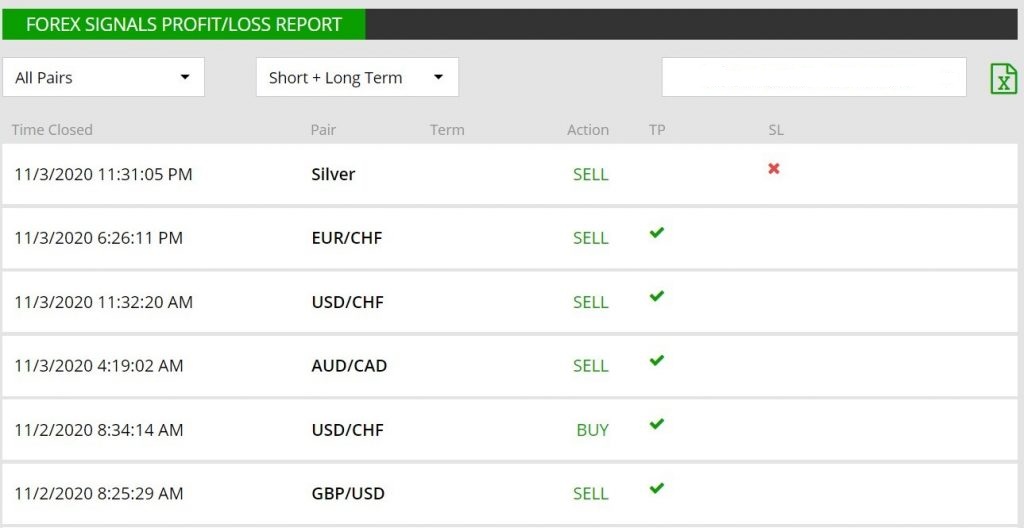
Forex Signals Profit/Loss Report
Trading Alerts

Signals News and Analysis
There are all sorts of forex signal services available. Many individual forex traders provide signals through the MT4/MT5 platforms or through their brokers as trade copiers, such as ZuluTrade or eToro. At FX Leaders, we have a team of professional traders and analysts who generate new forex signals every day. Our recommended forex broker for our premium signals is Avatrade - Read their in-depth broker review here!
Forex Economic Calendar

Frequently Asked Questions about Forex Signals
What Are Forex Signals?
How to Use Our Forex Signals?
How to Make the Most of Forex Signals?

Automated vs. Manual Forex Signals
Forex signals are trade ideas, not strict rules. You don’t need to follow every signal exactly as given. Stop loss and take profit levels simply outline the expected market range. If your strategy suggests more upside, you may extend or remove the take profit to maximize potential gains.
Our signals are created and managed manually by experienced analysts using human judgment and proven trading strategies, unlike automated signal services. Each approach has pros and cons, which we cover in our “Forex Signals – Auto vs. Manual” article.
How to Choose the Best Forex Signals Provider?

Forex Signals for Technical Traders

Forex Signals for Scalping

What Our Clients Are Saying
In Conclusion
FXLeaders delivers trading signals powered by real traders with hands-on market experience. Covering forex, crypto, stocks, indices, and commodities, their signals provide clear entry, stop-loss, and take-profit levels. With both free and premium plans, timely alerts, and a team of expert analysts, FXLeaders helps traders of all levels make smarter, more confident decisions every day.Faq
As a trade recommendation, the information and details such as the Buy/Sell action, the Opening Price, the Take Profit and Stop Loss targets and the Opening Time are specified well, which you can follow very easily when trading. But, you are not obligated to follow the instructions precisely as received. Signal receivers are also traders themselves and when there’s potential for more profit, they can also move the take profit target further to maximize profits.They can also move the stop loss, to nurse their trades, close their trades whenever they want or even not follow the signal at all, if markets have changed too fast.
A signals service is a provider who offers forex signals, issued either by professional forex traders and analysts or by an automated trading software. Some forex signal services provide free signals, while others offer them for a fee. 
The best depends mostly on performance, so the providers with the most profit are usually preferred. But, always after testing their performance, to see if it meets the results they claim. FX Leaders is one of the most popular analysis and forex signals provider, empowered by a team of experienced analysts who utilize a variety of skills and strategies and are worth following for trade recommendations. In addition, different other factors also take their weight in the total score card for a good signal provider. The option and the time you receive the message after the trade is open are important. The risk factor as well, because some signal providers open too many signals and place quite large stops. This increases the risk. Automated trading signals might be good at certain times, but they can’t read fundamentals, epidemics, OPEC decisions, politics, etc, when the potential for profit is immense. So, you have to combine all these factors to see what signal providers are best.
Sidebar rates
