Gold Price Forecast: Nearing $2,300 Amid Global Unrest and Fed Rate Speculation
In the recent trading sessions, the XAU/USD (Gold) price has soared to unprecedented levels, nearing the $2,300 threshold.
In the recent trading sessions, the XAU/USD (Gold) price has soared to unprecedented levels, nearing the $2,300 threshold. This surge is fueled by a mix of geopolitical tensions and market dynamics, underscoring a robust demand for this safe-haven asset.
The ongoing Russia-Ukraine conflict, along with unrest in the Middle East, has heightened investor anxiety, propelling the demand for gold. Additionally, the aftermath of a severe earthquake in Taiwan has further bolstered gold’s appeal as a secure investment.
The US Dollar has experienced a significant pullback from its peak, reached on February 14, amidst growing speculation about the Federal Reserve’s interest rate trajectory. This retreat in the dollar has contributed positively to the gold market’s upward momentum.
Market Outlook and Rate Cut Prospects
While the equity market exhibits a generally positive trend, gold’s rapid price increase has led to caution among investors, anticipating further clarity on the Fed’s rate cut strategy.
Upcoming economic data, particularly the Nonfarm Payrolls report, and remarks from Federal Reserve officials, are keenly awaited to determine gold’s next directional move.
The gold market’s recent performance, characterized by a new record high, underscores the intricate interplay of global events and economic policies affecting its valuation.
Investors remain vigilant, monitoring these developments closely to gauge future movements in the XAU/USD price trajectory.
Gold Price Forecast: Technical Outlook
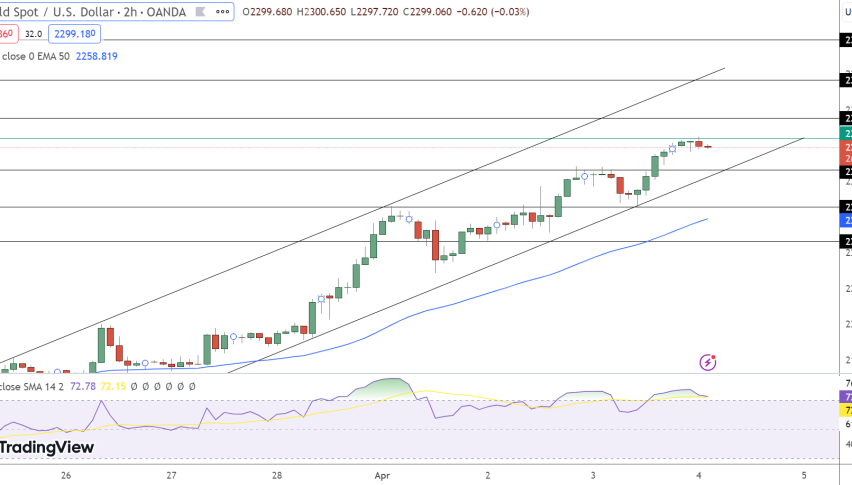
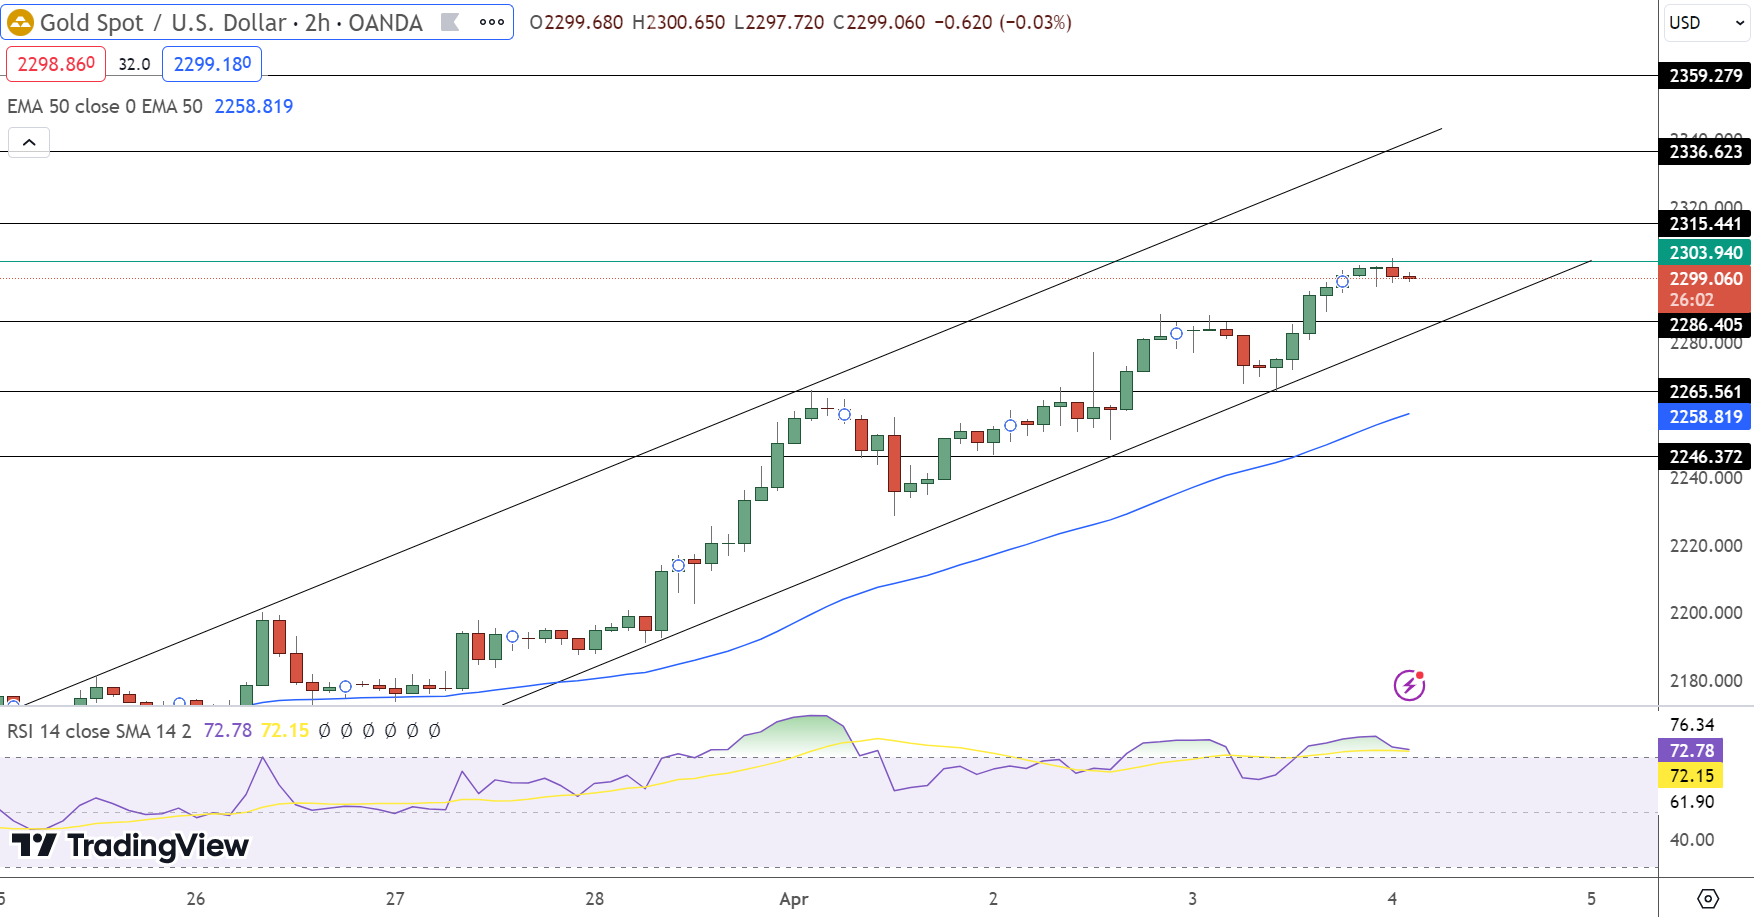
GOLD prices observed a slight decline to $2299.060, down by 0.03%. The current technical landscape indicates a pivotal point at $2303.94, with immediate resistance anticipated at $2315.44, followed by $2336.62 and $2359.28.
Conversely, immediate support levels stand at $2286.41, with subsequent levels at $2265.56 and $2246.37. The Relative Strength Index (RSI) registers at 72, signalling overbought conditions. Meanwhile, the 50-day Exponential Moving Average (EMA) sits at $2258.82.
Despite the minor setback, the upward channel continues to support bullish sentiment, particularly above the $2286 level. A breakout above $2303 could extend gains towards $2315 and beyond.
However, a breach below $2303 might trigger significant selling pressure.
- Check out our free forex signals
- Follow the top economic events on FX Leaders economic calendar
- Trade better, discover more Forex Trading Strategies
- Open a FREE Trading Account
- Read our latest reviews on: Avatrade, Exness, HFM and XM
Related Articles


Sidebar rates
Related Posts
