DAX Loses Ground Day After FOMC Meeting
The FOMC held its scheduled meeting yesterday, as expected no action was taken. The stock market reacted positively.
The FOMC held its scheduled meeting yesterday, as expected no action was taken. The stock market reacted positively.
The DAX reacted positively jumping 1.46% on the day. The US stock market also had a good day with the S&P 500 and the Nasdaq both hitting new all-time highs. The post meeting press conference gave a clear forward guidance on the path for interest rates.
The global stock markets have been eager to see a pivot-point happen in the Fed’s monetary policy. The DAX has been banking on further cuts from the ECB, but after Lagarde’s most recent comments that seems unlikely to occur soon.
The ECB will be hard pushed to make another cut before the Fed, as the euro would likely suffer. A falling forex rate would also import inflation pressure and be counter productive to the needs of the ECB.
What I saw yesterday from the market’s reaction baffled me, with major indices rallying. Today’s market reaction seems more inline with Powell’s comment from yesterday. In particular, the Fed chair said:
“It’s probably going to take longer to get confidence that we need to loosen policy, So, the sense of that is that rate cuts that might have taken place this year take place next year. You know, there are fewer rate cuts in the median this year, but there’s one more next year.”
So, rates will stay high for longer, and the market might just cope with this in the long run. However, as an initial reaction to the statement I would have expected a bearish move, which seems to be happening today, the DAX is down 1.1%.
Technical View
The Day chart below for the DAX show the market failed to break the resistance of the previous high of 18,634 (blue line) set in April. Yesterday’s rally fizzled overnight, and today’s candle has almost completely retraced the gains made yesterday.
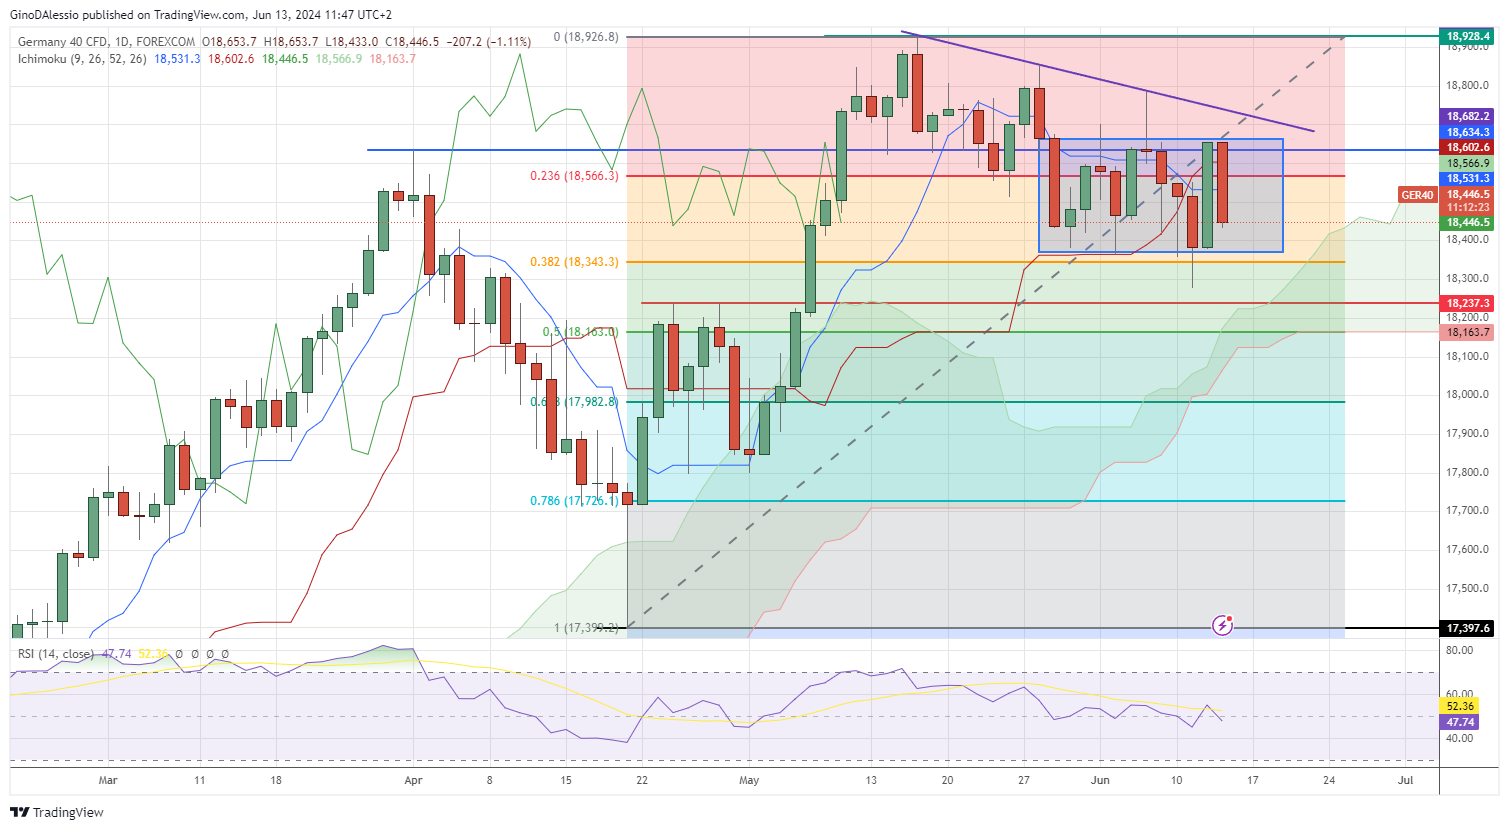
The market has been trending sideways for the past 11 candles creating a rectangular pattern (blue area). The signal for the next direction will come from a breakout above or below that area.
To the downside, the breakout would meet support on the 0.382 Fibonacci retracement level and the Ichimoku cloud.
While to the upside the market would find resistance on the purple trend line and then at the previous high of 18,853, followed by the all-time high of 18,928.
- Check out our free forex signals
- Follow the top economic events on FX Leaders economic calendar
- Trade better, discover more Forex Trading Strategies
- Open a FREE Trading Account
- Read our latest reviews on: Avatrade, Exness, HFM and XM
Related Articles


Sidebar rates
Related Posts
