The Highs Getting Lower in Gold As XAU Sellers Keep Returning
Gold buyers have been showing weakness as the Gold price keeps making lower highs, however, there is a support zone at place, around $2,270.

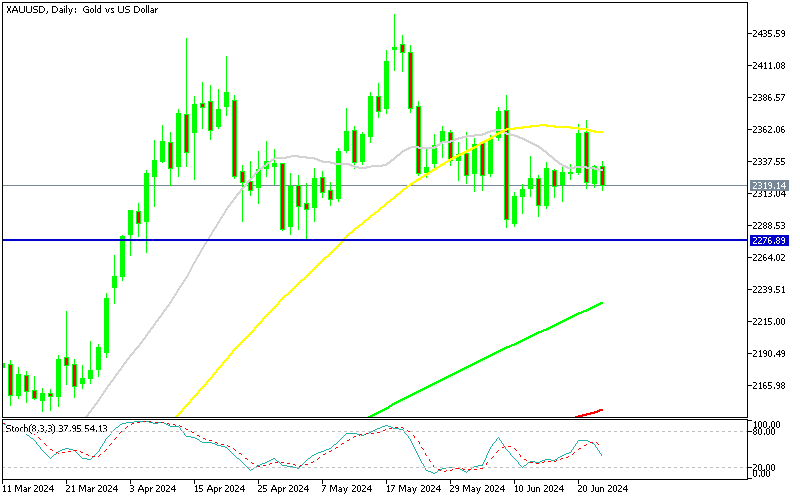
Gold buyers have been showing weakness as the Gold price keeps making lower highs, however, there is a support zone at place, around $2,270. But now moving averages are turning into resistance, with the 50 SMA (yellow) rejecting the price last week, which is a sign of a trend reversal, following the massive uptrend of the first four months of this year.
Gold Technical Analysis

For the past two months, GOLD has been forming lower highs, with a support zone around $2,270 suggesting a potential drop to $2,180 if the support level is breached. Early on Friday, gold buyers attempted to push past this month’s high but failed. Later in the day, sellers returned, driving the price down by $50 to $2,316.
On Monday Gold prices regained some ground as the USD weakened, but it lagged behind other assets like major currencies, which saw substantial gains against the USD. However, selling pressure returned yesterday, causing the gold price to fall back to previous levels, closing the day below $2,320.
Gold Chart Daily – The 50 SMA Has Turned Into Resistance
Yesterday, gold fell after hitting a peak of $2,334, as the US dollar rebounded. This recovery was supported by a slight increase in US Treasury bond yields, spurred by hawkish remarks from Federal Reserve (Fed) Governor Michelle Bowman. Bowman emphasized that monetary policy should stay steady for “some time,” asserting it would likely suffice to bring down inflation. She dismissed the idea of rate cuts this year and indicated readiness to raise rates if progress on inflation stalls or even reverses, but that’s highly unlikely.
Gold Live Chart
- Check out our free forex signals
- Follow the top economic events on FX Leaders economic calendar
- Trade better, discover more Forex Trading Strategies
- Open a FREE Trading Account
- Read our latest reviews on: Avatrade, Exness, HFM and XM
Related Articles


Sidebar rates
Related Posts
