Forex Signals Brief July 16: Canada CPI Inflation and US Retail Sales!
Today the CPI inflation report form Canada and the US retail sales will likely have a strong effect of the CAD and USD respectively.

Yesterday the week started with a round of economic data from China which once again leaned on the soft side, setting the tone for the Asian and European sessions. as A Result, European and Asian stock markets ended up lower, while risk currencies gained against the USD, which started the week on the soft side too.

Markets largely ignored the shocking attack on Republican nominee Donald Trump’s life over the weekend. Despite the dramatic events, including the opening of the Republican National Convention where Trump officially announced his candidacy and selected JD Vance as his vice-presidential running mate, the so-called “Trump Trade” gained momentum. This trade involves selling long-term bonds, which steepens the yield curve, and buying stocks, Bitcoin, and the USD, which appreciated yesterday as odds of a Republican sweep increased.
The NZD was the weakest major currency, while the USD was the strongest. The Trump Trade is driven by expectations that a Trump administration would reduce regulations, support lower interest rates and taxes, potentially boost oil drilling, leading to lower oil prices, and impose tariffs on China. On the economic front, the Empire Manufacturing Index came in at -6.6 points, slightly better than the forecast of -7.0 points.
Besides that, Fed’s Powell, in his speech at the Economic Club of Washington, highlighted the economy’s strong performance over the past few years while noting a slowdown and ongoing progress in reducing inflation. He pointed to recent positive inflation data and emphasized that the labor market is no tighter than it was before the pandemic. Powell cautioned against delaying actions on inflation and reiterated that the Fed’s decisions will be based on evolving data, closing the door for a July rate cut, which also helped the USD.
Today’s Market Expectations
Today we have two main economic events, which start with the inflation report from Canada. The Canadian Trimmed Mean CPI year-over-year is forecasted to be 2.8%, slightly down from 2.9% in the previous year. Similarly, the Median CPI year-over-year is anticipated to be 2.7%, down from the prior 2.8%. With wage growth rising to 5.6% in the latest labor market report, the Bank of Canada will likely need to see favorable data to proceed with a second rate cut in July. Currently, the market predicts a 78% chance of a rate cut in July, but if the data exceeds expectations, this probability could drop to around 50%.
The US Retail Sales month-over-month is forecasted to be 0.0%, compared to the previous 0.1%, while the Ex-Autos metric is expected to be 0.1%, up from -0.1% previously. Consumer spending has remained relatively stable, which is expected given the positive real wage growth and robust labor market. However, there has been a decline in the UMich Consumer Sentiment Index, suggesting that consumer spending may slow down slightly.
Yesterday the price action was mixed initially, with stock markets retreating during the Asian and European session but reversing higher in the US sessions despite higher USD, following the balanced rhetoric from Jerome Powell. We opened 8 trading signals in total, however only 5 closed, with four forex signals closing in profit while one close in loss.
Gold Buyers Testing the 50 Daily SMA
Gold surged over $40 on Thursday, breaking past $2,400, and after a brief pullback on Friday, it resumed its upward trend yesterday. As XAU approaches its previous record high, a renewed wave of interest has emerged. In the last few minutes, gold prices have jumped by more than $20 to $2437.30, the second-highest level. Today, gold buyers seem driven by forecasts regarding bonds, the possibility of a Republican sweep, and expectations of increased government spending and deficits. Additionally, ongoing trade tensions and tariffs are strengthening the argument for some countries, especially China, to boost their gold reserves. The all-time high of $2450 was reached in May.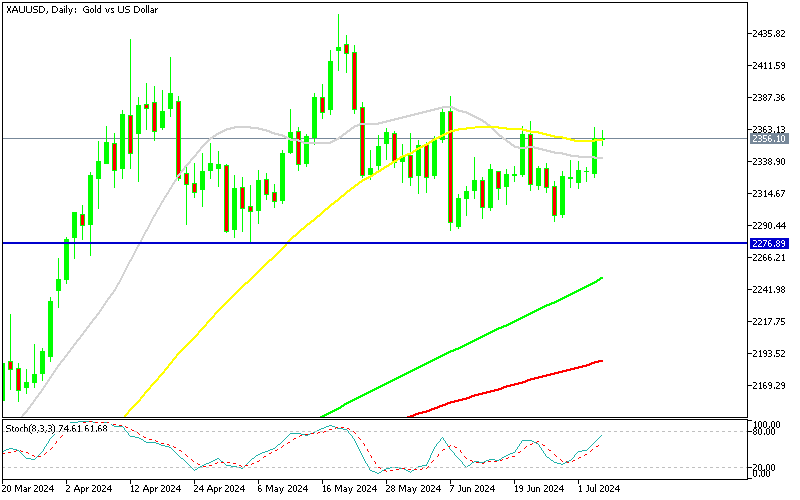
XAU/USD – Daily chart
The 50 SMAs Hold Again for USD/JPY
In the first quarter of this year, USD/CAD encountered resistance at 1.36, but eventually broke through, converting it to a support zone. The trading range has widened by two cents, with resistance now at 1.38. This week, the USD declined, pushing USD/CAD to the lower end of the range. However, weak economic data from Canada put pressure on the CAD, aiding USD/CAD buyers. The pair dipped below 1.36 last week following a softer US CPI report. However, stronger-than-expected PPI inflation has cast doubt on widespread market speculation that the Federal Reserve will start cutting interest rates at the September meeting, a notion initially fueled by weaker consumer inflation and a softening labor market. Yesterday, Canada’s Manufacturing and Wholesale Sales reports both came in weak, propelling USD/CAD 40 pips higher.
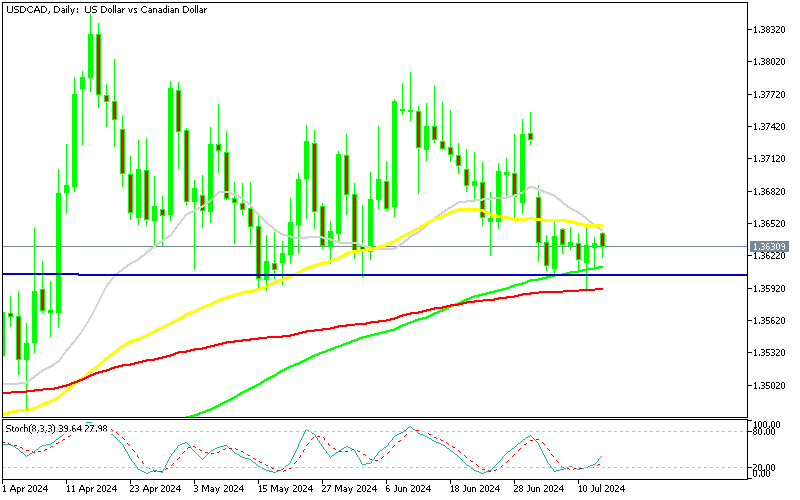
USD/CAD – Daily Chart
Cryptocurrency Update
Bitcoin Remains Below $60K
Previously, Bitcoin had strong support around $60,000. However, it has recently experienced a significant decline. Cryptocurrency prices have plummeted this week, with Bitcoin falling below $60,000 yesterday and continuing to drop today, nearing the next critical level from early May. There was a brief dip below $57,000, suggesting the potential for a larger chart breakdown. The 200-day moving average (purple line), which was breached in May but had previously held steady at $57,000, is now under threat again. However, support at $58,000 held firm on the first attempt. A sustained drop below this level—the first major breach since October of last year—would indicate a shift towards bearish momentum for Bitcoin. Despite this, buyers have reentered the market, pushing the price above the moving averages and aiming for $70,000 once more.
BTC/USD – Daily chart
Ethereum Hold Above $3,000
Since the launch of its ETF, Ethereum (ETH) has experienced significant volatility, reaching a peak of $3,832.50. The surge was driven by improved market sentiment following the SEC’s decision to support spot Ethereum ETFs. With ETH up 25% from its previous peak, there is evident market demand and substantial investor interest. However, Ethereum recently dipped below $3,000. We are now witnessing a rebound from this key level. For buyers of ETH to establish a long-term uptrend, they need to push the price above the 50-day Simple Moving Average (SMA) indicated by the yellow line.
ETH/USD – Daily chart
- Check out our free forex signals
- Follow the top economic events on FX Leaders economic calendar
- Trade better, discover more Forex Trading Strategies
- Open a FREE Trading Account
- Read our latest reviews on: Avatrade, Exness, HFM and XM
Related Articles


Sidebar rates
Related Posts
