Gold (XAU) Daily News: Market Awaits Powell’s Speech – Can Gold Sustain Above $2,480?
Gold prices (XAU/USD) are showing signs of recovery after halting a downward trend, with prices climbing to $2,492.85 and reaching

Gold prices (XAU/USD) are showing signs of recovery after halting a downward trend, with prices climbing to $2,492.85 and reaching an intraday high of $2,495.81.

This upward movement is largely driven by a weakening US dollar, as expectations of a dovish stance from the Federal Reserve prompt selling pressure on the USD. The anticipation of potential interest rate cuts at the Fed’s September meeting is further supporting gold prices, as a lower dollar typically makes gold more attractive to investors.
Impact of Fed Rate Cut Expectations on Gold Prices
The broader market sentiment remains bullish on gold due to the growing expectation that the Federal Reserve will begin lowering interest rates. The recent rise in US Treasury bond yields offered brief support to the dollar, but this was insufficient to sustain its strength, as many investors now anticipate a rate-cutting cycle to begin soon. This has helped to limit losses for gold, keeping it well-supported in the market.
#GOLD is trading at $2,493, with potential testing at $2,485, $2,480, and $2,470, and retesting at $2,505, $2,510, and $2,520 if above $2,500.
Today is #FOMC Member Goolsbee Speaks &#FedMeeting
For reliable signals,
Join nowhttps://t.co/GcGD0Prs5f#XAUUSD #Fed #forex pic.twitter.com/mUDjukk6uO— Samara.Fx (@Xauusd_Sam) August 23, 2024
Economic data from the US also plays a crucial role in this dynamic. The US Department of Labor reported that Initial Jobless Claims rose to 232,000, slightly higher than the previous week’s 228,000. Moreover, revisions to employment figures revealed that US employers added 818,000 fewer jobs than initially reported for the year through March. These developments have further fueled speculation of an impending rate cut, which is favorable for gold prices.
Geopolitical Tensions Continue to Support Gold
Ongoing geopolitical tensions also contribute to gold’s appeal as a safe-haven asset. The uncertainties surrounding global political stability have bolstered gold’s position as a preferred investment during times of risk and market volatility. As these tensions persist, gold prices are likely to remain well-supported, with investors seeking refuge in the metal.
📢 Traders – Check out Today’s Market Watch 📈💰
📊 Market Update: The U.S. dollar slipped as weaker-than-expected employment data fueled speculation of a Fed rate cut in September. Geopolitical tensions are keeping markets on edge, boosting safe-haven demand.
💰 Gold (XAU/USD):… pic.twitter.com/W2lTuey3Ho— ETO Markets (@EtoMarkets) August 23, 2024
Technical Outlook and Trading Strategy
Gold is currently trading at $2,492.85, reflecting a modest gain of 0.33%. The pivot point at $2,503.37 is a critical level to watch, as a break above it could signal further upward movement toward the $2,520.98 resistance level.
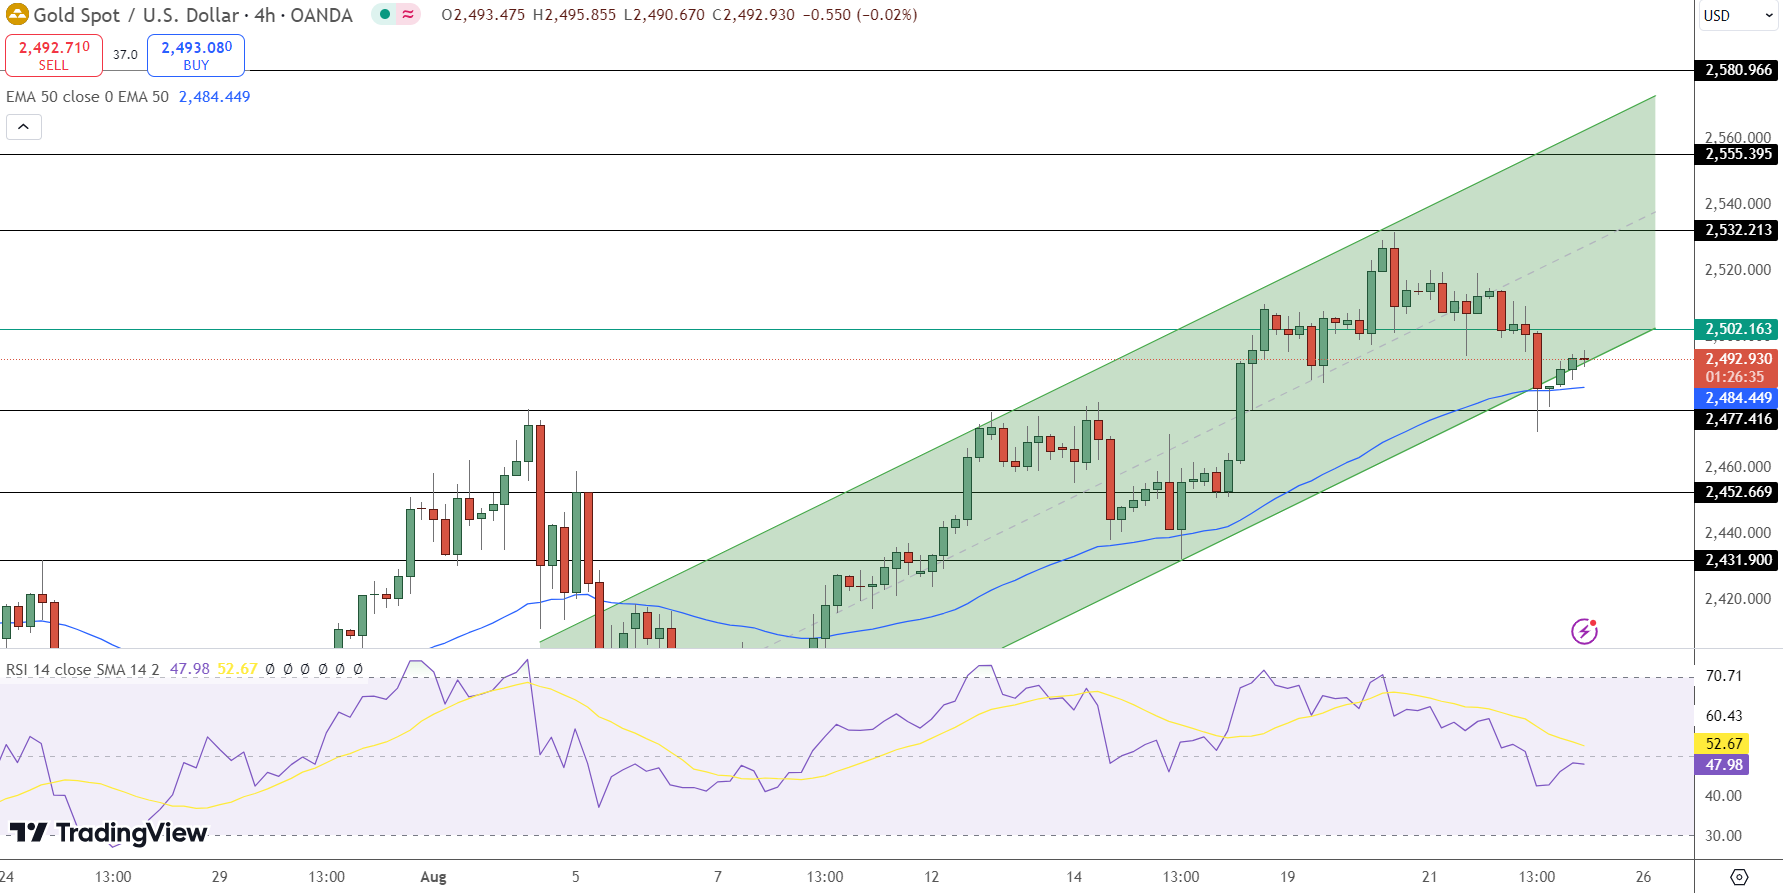
On the downside, key support is found at $2,475.81, with additional support levels at $2,450.95 and $2,432.88. The Relative Strength Index (RSI) stands at 48, indicating neutral momentum, while the 50-day Exponential Moving Average (EMA) at $2,485.74 offers underlying support.
- Check out our free forex signals
- Follow the top economic events on FX Leaders economic calendar
- Trade better, discover more Forex Trading Strategies
- Open a FREE Trading Account
- Read our latest reviews on: Avatrade, Exness, HFM and XM
Related Articles


Sidebar rates
Related Posts
