Last week, GME explosively broke above the golden ratio resistance at $30, gaining 20%. With this key level cleared, the stock now targets the next Fibonacci resistances at $36 and $48, supported by strong momentum and volume.
GameStop (GME) Stock Explodes 20% in a Week: $48 Next?
•
Last updated: Monday, May 26, 2025

Quick overview
- GameStop (GME) has surged 20% after breaking the $30 resistance, now targeting Fibonacci levels at $36 and $48.
- Technical indicators across multiple timeframes show strong bullish momentum, including golden cross formations and bullish MACD signals.
- The RSI remains neutral, allowing for further upside potential without immediate overbought pressure.
- Key support levels are identified at $28.40 and $25 in case of a pullback.
GameStop (GME) Stock Eyes Fib Level At $36
GameStop (GME) has been trending upwards for eight consecutive weeks, breaking through the golden ratio resistance at $30 last week and surging ~20%. The next target lies at the 0.382 Fib level around $36 as the uptrend gains strength.
Technicals on the weekly chart support continued upside:
-
EMAs have formed a golden crossover, confirming a mid-term bullish trend
-
MACD lines are bullishly crossed, with a rising histogram
-
RSI remains neutral, with room to push into overbought territory
The setup suggests momentum could carry GME toward higher resistance levels in the coming sessions.
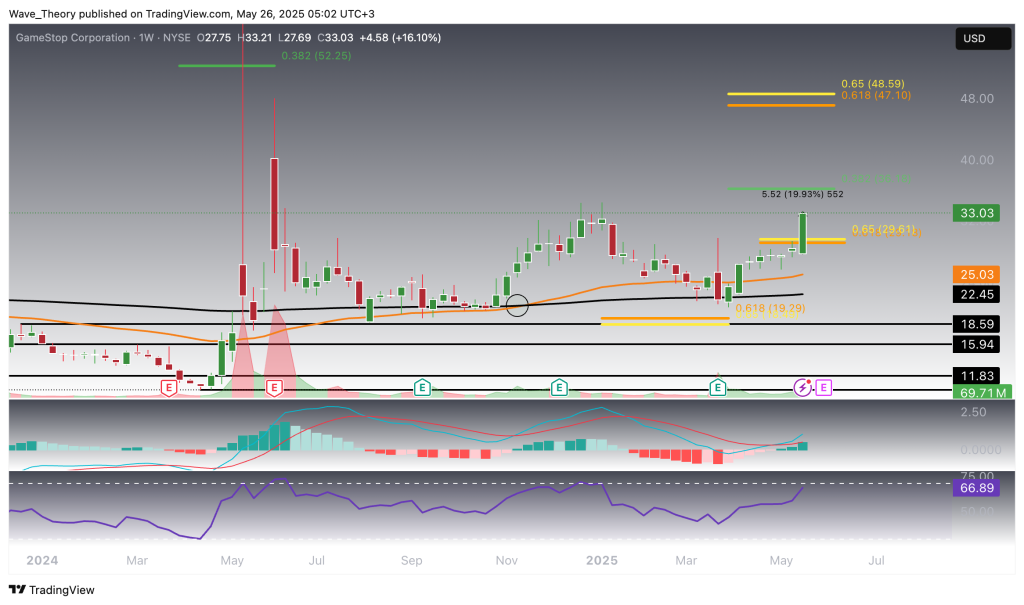
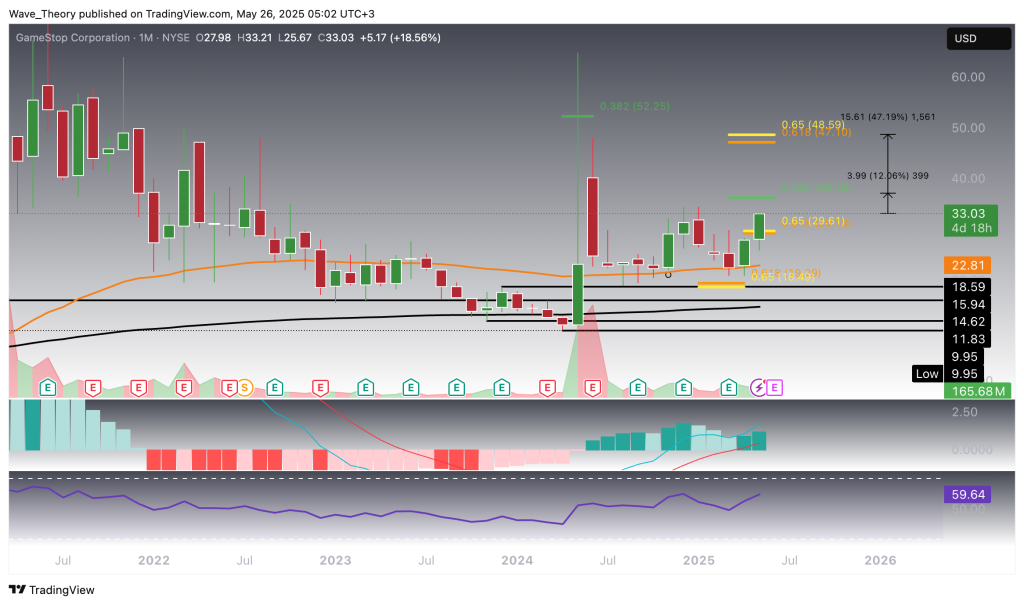
With upside potential ranging from 12% to 47% toward the next Fibonacci resistance levels, GameStop (GME) remains technically positioned for further gains. A break above the golden ratio at $48 would mark a shift out of its broader corrective phase, confirming a return to its long-term uptrend.
On the monthly chart, indicators support this outlook:
-
EMAs and MACD lines are bullishly crossed, signaling a sustained long-term trend
-
MACD histogram has ticked higher for two consecutive months, reflecting increasing momentum
-
RSI remains neutral, offering room for continued upside without immediate overbought pressure
This macro setup reinforces GME’s potential for an extended bullish breakout if momentum persists.
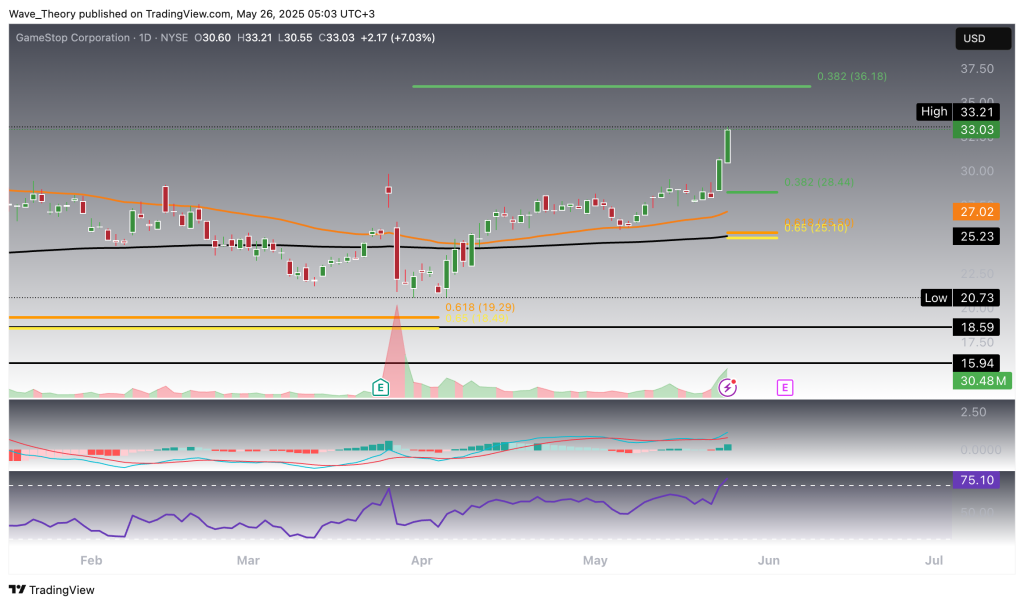
Bullish Signals Strengthen on GameStop (GME) Daily Chart
GameStop (GME) continues to flash bullish signals on the daily chart. The golden crossover formation remains intact, reinforcing the bullish trend in the short to mid term. Additionally, the MACD lines are bullishly crossed, with the histogram trending higher, further confirming upward momentum.
While the RSI approaches overbought territory, it has yet to signal a reversal. Should GME face a pullback, key Fibonacci support levels lie at $28.40 and $25.00, offering potential bounce zones.
Summary
- Check out our free forex signals
- Follow the top economic events on FX Leaders economic calendar
- Trade better, discover more Forex Trading Strategies
- Open a FREE Trading Account
- Read our latest reviews on: Avatrade, Exness, HFM and XM
ABOUT THE AUTHOR
See More
Konstantin Kaiser
Financial Writer and Market Analyst
Konstantin Kaiser comes from a data science background and has significant experience in quantitative trading. His interest in technology took a notable turn in 2013 when he discovered Bitcoin and was instantly intrigued by the potential of this disruptive technology.