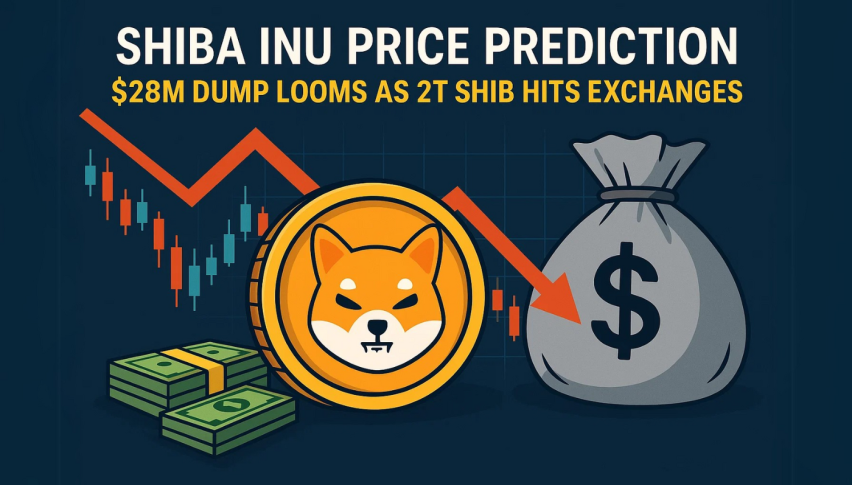
Shiba Inu Price Prediction: $28M Dump Looms as 2T SHIB Hits Exchanges
Shiba Inu (SHIB) is feeling the pressure. Its price recently slipped to around $0.00001359, marking a sharp 5.8% drop in just 24 hours.
Quick overview
- Shiba Inu (SHIB) has experienced a 5.8% price drop, currently trading at $0.00001359 with a market cap of $8.44 billion.
- Recent data indicates that 2 trillion SHIB tokens have moved onto exchanges, increasing the exchange-held supply and potential selling pressure.
- Technical analysis shows bearish momentum, with a critical support level at $0.00001344 that could lead to further declines if broken.
- Traders are advised to set clear risk levels and remain cautious, as the outlook for SHIB remains challenging without a strong bullish catalyst.
Shiba Inu (SHIB) is feeling the pressure. Its price recently slipped to around $0.00001359, marking a sharp 5.8% drop in just 24 hours. The market cap has dipped to $8.44 billion, with 24-hour trading volume hovering at about $180 million. What’s more concerning? Recent data shows a staggering 2 trillion SHIB tokens have been moved onto exchanges over the past month. This influx has pushed the total exchange-held supply from 139 trillion to 141 trillion—translating to over $28 million worth of tokens poised for potential selling pressure.
-
Market Cap: $8.44 billion
-
24-Hour Volume: $180 million
-
Daily Price Range: $0.0000141–$0.0000146
Technical Patterns Spell Trouble for SHIB
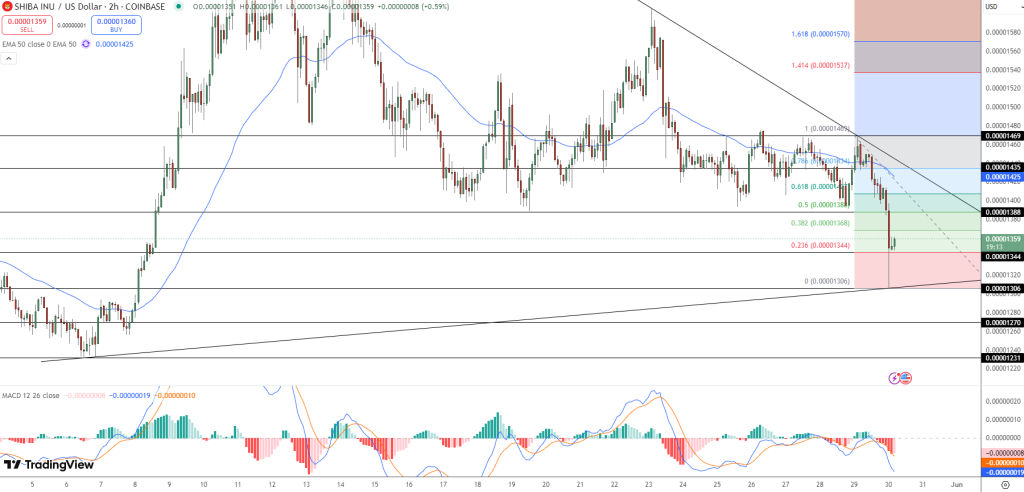
On the charts, SHIB has broken below its 50-EMA at $0.00001425, signaling mounting bearish momentum. The descending triangle pattern, capped by a steep trendline, points to continued downward pressure. Recent bullish attempts failed—marked by spinning tops and long upper wicks—before a decisive bearish engulfing candle broke below the 0.382 Fibonacci retracement at $0.00001368.
The MACD indicator confirms the bearish outlook, showing a deepening negative histogram and a bearish crossover. If SHIB breaks below $0.00001344, it could open the door to further declines toward $0.00001306 or even $0.00001270.
For traders looking to ride the trend:
-
Short Entry: Below $0.00001340, with a stop above $0.00001425.
-
Targets: $0.00001306 and $0.00001270.
-
Bullish Reversal: A sharp rebound above $0.00001425, backed by confirmation, could push the price toward $0.00001460 or higher.
Investor Takeaway: Stay Cautious
The surge in SHIB tokens on exchanges, coupled with sustained bearish momentum, paints a challenging picture for the token’s near-term outlook. Unless a strong bullish catalyst emerges—like a spike in demand or positive market news—SHIB could continue its downward slide.
-
On-chain data shows increasing selling pressure.
-
Technical patterns signal more downside unless strong demand reverses the trend.
-
Traders should set clear risk levels and watch for reversal signals.
For cautious traders and long-term holders, it’s a wait-and-see game. Stay vigilant, monitor support levels, and be prepared for potential volatility.
- Check out our free forex signals
- Follow the top economic events on FX Leaders economic calendar
- Trade better, discover more Forex Trading Strategies
- Open a FREE Trading Account
- Read our latest reviews on: Avatrade, Exness, HFM and XM
Related Articles


Sidebar rates
Related Posts
