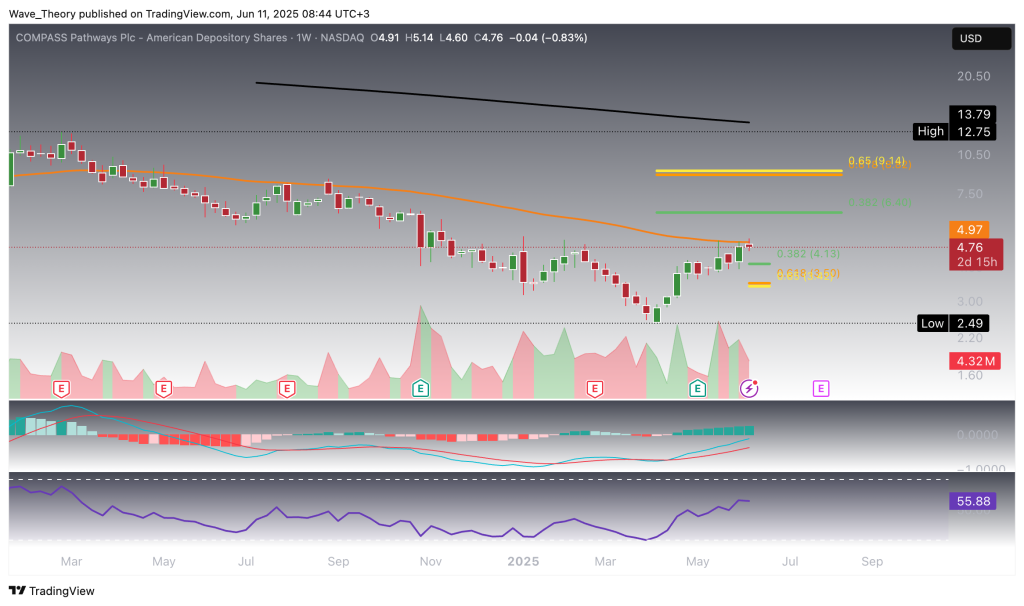
Currently, COMPASS Pathways (CMPS) is testing major resistance at the 50-week EMA near $5.00, a level that could trigger a short-term rejection and initiate a corrective move toward the next Fibonacci support zones at $4.13 and $3.40. Despite this potential pullback, the broader outlook on the weekly chart remains constructive. Although the EMAs still reflect a mid-term bearish structure via a confirmed death cross, momentum indicators have turned decisively positive: the MACD lines crossed bullishly several weeks ago, the MACD histogram continues to trend strongly higher, and the RSI remains in neutral territory, signaling room for further upside if resistance is cleared.
COMPASS Pathways (CMPS) Forms Potential Bottom — Is a Rally on the Horizon?
•
Last updated: Wednesday, June 11, 2025

Quick overview
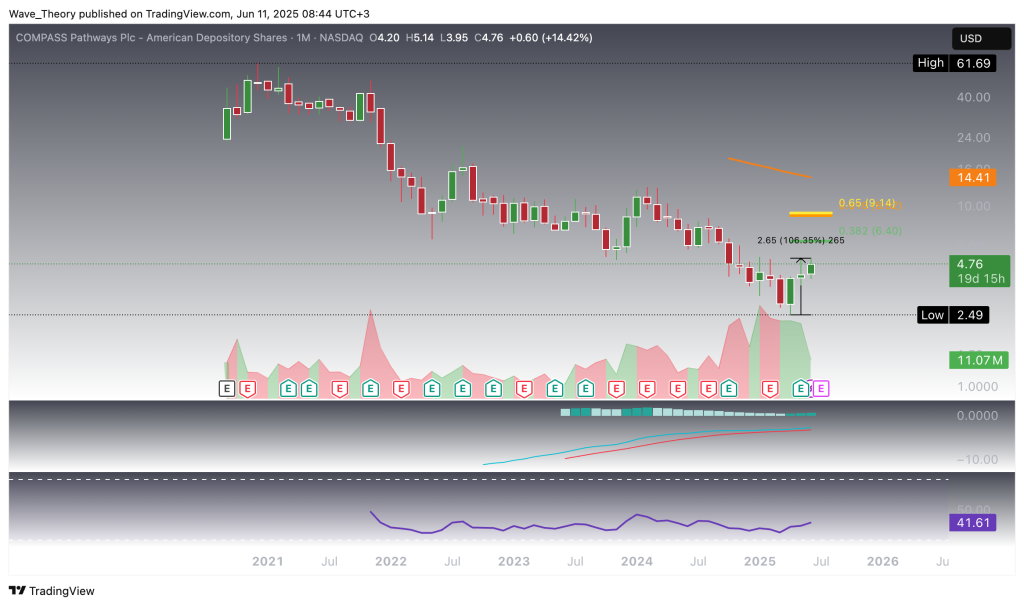
- COMPASS Pathways (CMPS) has seen a significant 106% increase since April, following a bullish engulfing pattern.
- The stock is currently testing resistance at the 50-week EMA around $5.00, which could trigger a corrective move if not surpassed.
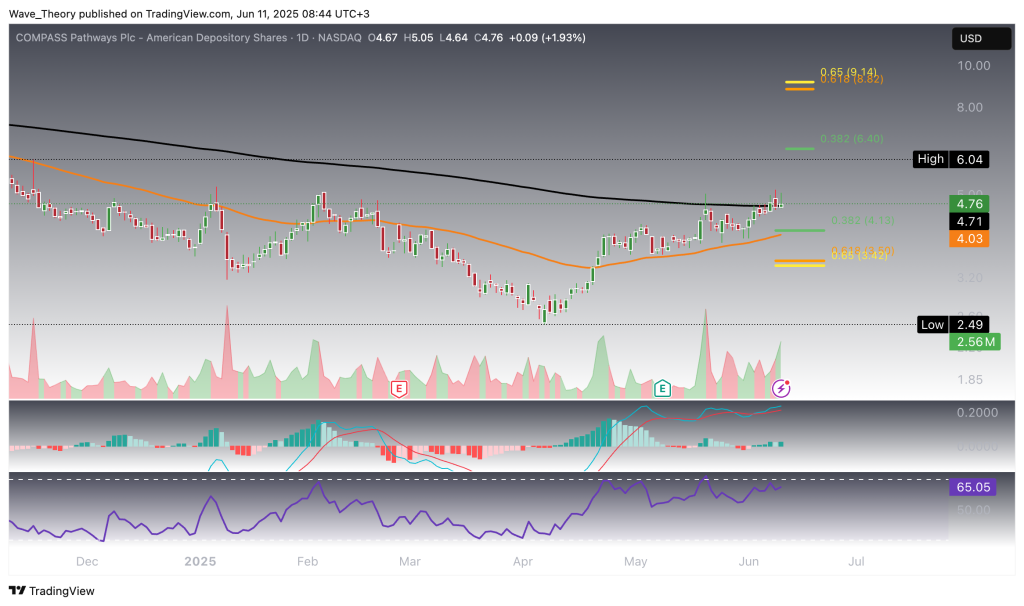
- Despite a mixed outlook on the daily chart, short-term indicators show potential for further upside if the resistance is cleared.
- Key Fibonacci resistance levels are identified at $6.40 and $9.10, while support levels are at $4.13 and $3.40.
Compass Pathways (NASDAQ: CMPS) is a leading biotech developing COMP360, a proprietary psilocybin-based therapy aimed at treatment‑resistant depression (TRD), currently in Phase III trials and granted Breakthrough Therapy designation by the FDA.
COMPASS Pathways (CMPS) Bottom Formation: Bullish Engulfing Candle On The Monthly Chart
COMPASS Pathways (CMPS) has exhibited a strong technical reversal, marked by a bullish engulfing candle in April following a new low at $2.49. Since that inflection point, the stock has surged by over 106%, effectively doubling in value. This rally is supported by sustained momentum: the MACD histogram has been ticking bullishly higher for three consecutive months, and the MACD lines remain firmly bullishly crossed. Meanwhile, the RSI hovers in neutral territory, suggesting there’s still room for further upside before overbought conditions emerge.
With CMPS currently trading at $4.76, the chart structure points to substantial upside potential. The next key Fibonacci resistance levels are located at $6.40 and $9.10, offering technically grounded targets for a continued rally.
COMPASS Pathways (CMPS) Faces Significant Resistance At The 50-Week-EMA
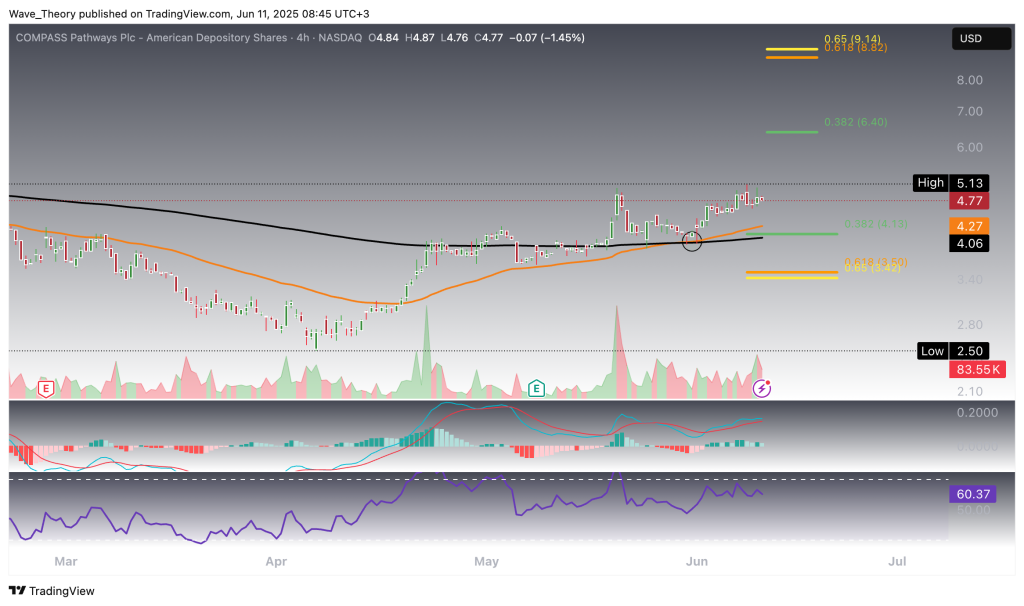
Golden Crossover On The 4H Chart Emerges
COMPASS Pathways (CMPS) Technical Summary
CMPS has surged over 106% from its April low at $2.49, forming a bullish engulfing pattern and signaling a potential trend reversal. The stock now faces key resistance at the 50-week EMA ($5.00). A breakout above this level could target $6.40 and $9.10 (Fibonacci resistances).
-
Weekly Chart: MACD is bullish, RSI neutral, but a death cross remains. Supports at $4.13, $3.40.
-
Daily Chart: EMAs still bearish; MACD turning bullish; RSI shows bearish divergence.
-
4H Chart: Short-term trend is bullish with a golden EMA crossover, though momentum is choppy.
Key Levels:
-
Resistance: $5.00, $6.40, $9.10
-
Support: $4.13, $3.40, $2.49
Outlook: Bullish momentum is building, but $5.00 remains a critical breakout level.
- Check out our free forex signals
- Follow the top economic events on FX Leaders economic calendar
- Trade better, discover more Forex Trading Strategies
- Open a FREE Trading Account
- Read our latest reviews on: Avatrade, Exness, HFM and XM
ABOUT THE AUTHOR
See More
Konstantin Kaiser
Financial Writer and Market Analyst
Konstantin Kaiser comes from a data science background and has significant experience in quantitative trading. His interest in technology took a notable turn in 2013 when he discovered Bitcoin and was instantly intrigued by the potential of this disruptive technology.
Related Articles
Sidebar rates
