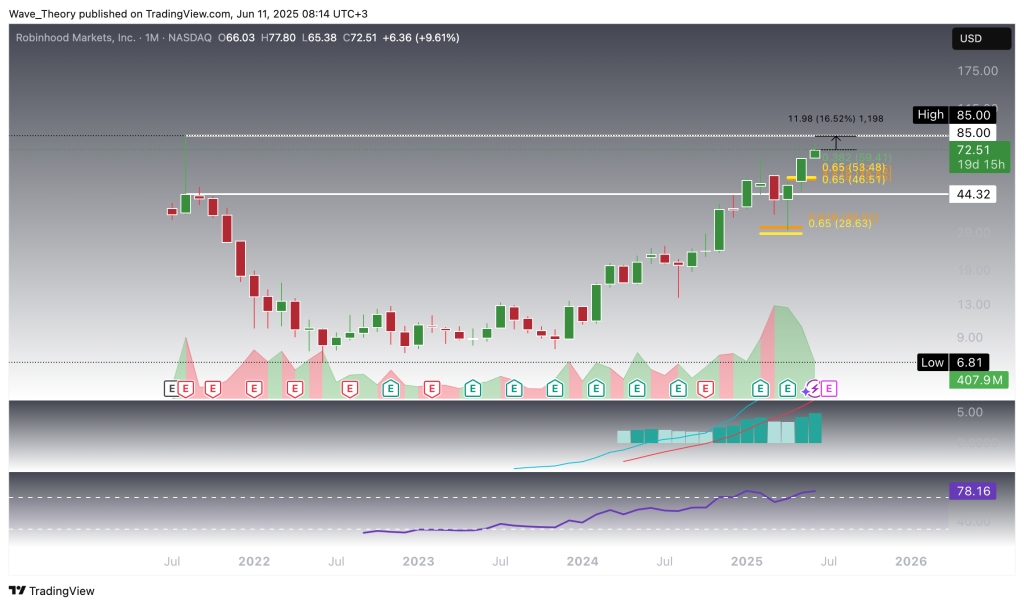
Robinhood (HOOD) stock has surged to a temporary high of $77.80, breaking past the $54 Fibonacci resistance level.
The stock is poised for a potential move toward its all-time high of $85, representing an upside of approximately 16.5%.
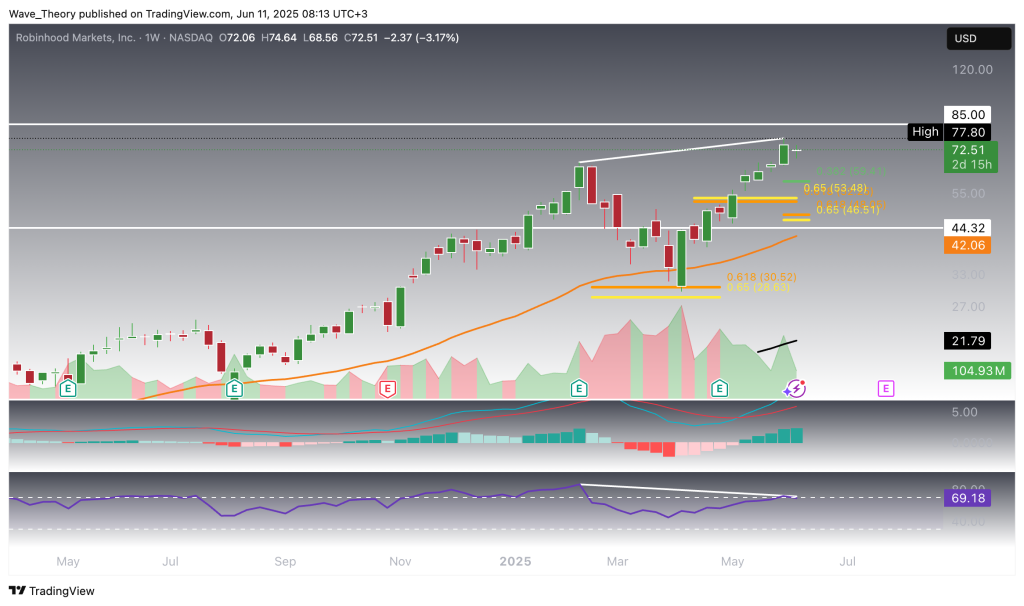
However, a significant bearish divergence on the weekly RSI indicates potential exhaustion and warrants caution.
Key support levels to watch include $64.30, $59.40, $47.00, and $42.00, which may signal a corrective phase.
Robinhood (HOOD) stock has surged to a temporary high of $77.80, breaking past the golden ratio resistance by an impressive 45%. The question now is: can HOOD sustain this momentum and push toward a new all-time high (ath)?
Robinhood (HOOD) Stock Reaches $77.8
In my previous analysis, I noted that Robinhood (HOOD) was approaching a critical test at the $54 Fibonacci resistance level, with a confirmed breakout likely paving the way toward the $67 region and potentially even a retest of the all-time high at $85. Since then, HOOD has decisively broken above the $54 Fib threshold, establishing a new local high at $77.80. The technical structure now favors a continued rally toward the all-time high of $85, representing a further upside potential of approximately 16.5%. Momentum indicators support this bullish outlook: the MACD histogram has been trending higher since last month, the MACD lines remain bullishly crossed, and the RSI is advancing into overbought territory—yet notably, it has not issued any bearish divergence signals.
Robinhood
Bearish Divergence Emerges On The Weekly RSI
On the weekly chart, the RSI is signaling a significant bearish divergence, which warrants caution despite the broader bullish structure. The MACD lines and EMAs remain bullishly crossed, and the histogram continues to reflect sustained upward momentum. Notably, the trend remains confirmed in the mid-term by the golden crossover of the EMAs. However, the pronounced RSI divergence is a classic warning sign of potential exhaustion. Should selling pressure emerge, HOOD could initiate a corrective move toward the next Fibonacci support levels at $59.40 and $47.00. Further downside could see the stock testing the 50-week EMA around $42.00, which serves as additional structural support.
Robinhood
Robinhood Faces Potential Correction: Key Support Levels To Watch
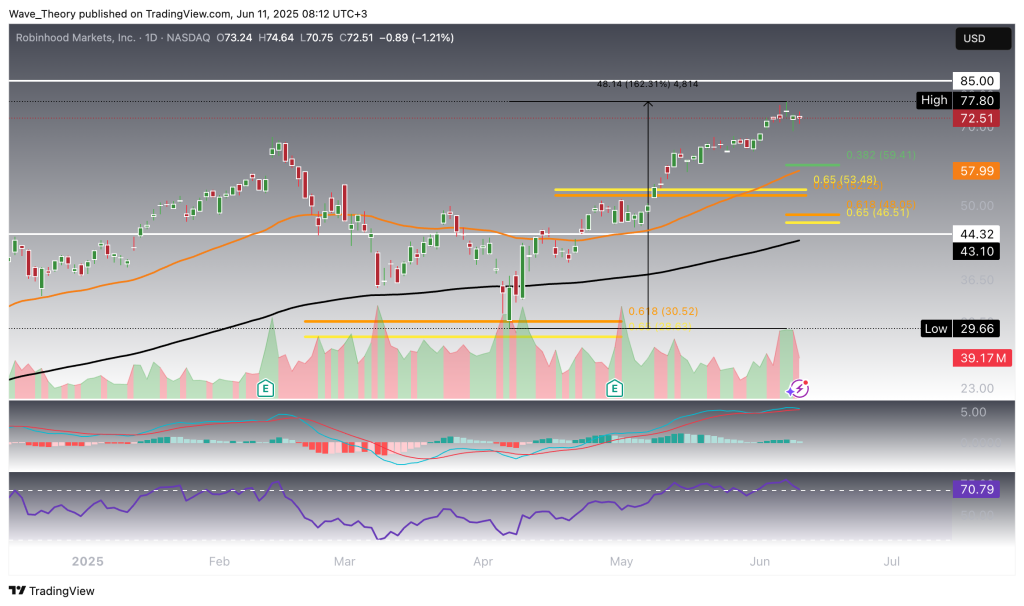
On the daily chart, the MACD lines and EMAs remain bullishly crossed, reinforcing the short- to medium-term bullish trend. However, early signs of weakening momentum are emerging: the MACD histogram has been ticking bearishly lower since yesterday, and the RSI is approaching overbought territory. While the trend remains intact for now, these developments could signal an impending shift in short-term momentum.
Robinhood
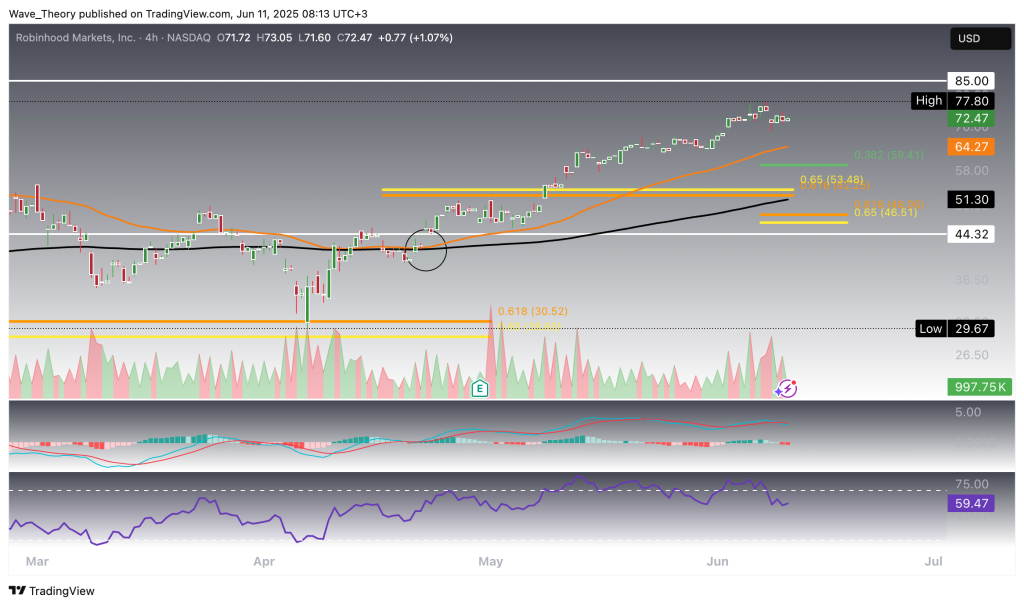
The 4H Chart Of Robinhood Gives Mixed Signals
On the 4H chart, the EMAs have recently formed a golden crossover, confirming the bullish trend in the short term. However, momentum indicators are beginning to diverge: the MACD lines have crossed bearishly, with the histogram ticking lower over the past few days, and the RSI has exited overbought territory, returning to neutral levels. Should Robinhood enter a corrective phase, initial support is expected at the 50-4H EMA, currently positioned at $64.30.
Robinhood
Robinhood (HOOD) Technical Summary:
Robinhood has decisively broken the key Fibonacci resistance at $54, reaching a new local high at $77.80. With the bullish structure intact, the stock is now poised for a potential move toward its all-time high at $85, representing 16.5% upside. However, caution is warranted:
Weekly Chart: A massive bearish RSI divergence signals potential exhaustion. Key supports lie at $59.40 and $47.00 (Fib levels), with the 50-week EMA at $42.00 offering additional downside support.
Daily Chart: EMAs and MACD lines remain bullishly crossed, confirming the trend in the short- to medium term. Yet, the MACD histogram is ticking lower, and the RSI nears overbought territory, suggesting waning momentum. Initial support rests at the 50-4H EMA near $64.30.
Conclusion: Trend remains bullish, but warning signs of a correction are emerging. Key support zones to watch: $64.30, $59.40, $47.00, and $42.00.
Konstantin Kaiser comes from a data science background and has significant experience in quantitative trading. His interest in technology took a notable turn in 2013 when he discovered Bitcoin and was instantly intrigued by the potential of this disruptive technology.