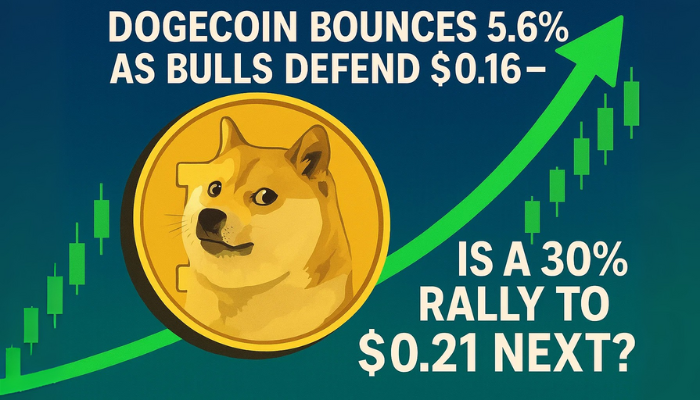
Dogecoin Bounces 5.6% as Bulls Defend $0.16—Is a 30% Rally to $0.21 Next?
Dogecoin (DOGE/USD) surged 5.63% in the past 24 hours, climbing to $0.1629 and reclaiming the #9 spot by market cap with $24.4 billion.
Quick overview
- Dogecoin (DOGE) surged 5.63% to $0.1629, reclaiming the #9 market cap position with $24.4 billion.
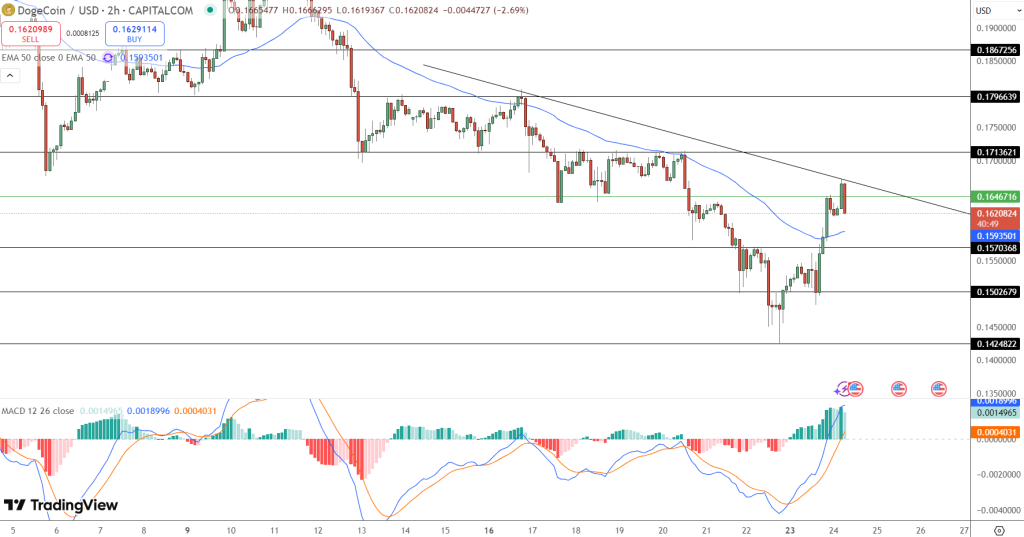
- The price is currently stalling at $0.1647, facing resistance from a descending trendline and the 50-EMA.
- Key support levels are identified between $0.1570 and $0.1593, while a bullish breakout above $0.1647 could target $0.1713.
- On-chain metrics indicate potential capitulation, suggesting a critical moment for DOGE's price action.
Dogecoin (DOGE/USD) surged 5.63% in the past 24 hours, climbing to $0.1629 and reclaiming the #9 spot by market cap with $24.4 billion. Trading volume also spiked to $1.53 billion, highlighting renewed interest after the meme coin revisited a crucial demand zone between $0.142 and $0.160.
This zone has proven historically reliable for bullish reversals. Back in March, DOGE rallied 40% after tagging $0.14, and in April, it surged from $0.14 to $0.25. The pattern now appears to be repeating, supported by a relative strength index (RSI) hovering near oversold and a 30-day Market Value to Realized Value (MVRV) ratio at -15.43%—signaling short-term capitulation.
Support Zone Insights:
- $0.142–$0.160 has triggered rallies twice in 2024
- RSI near oversold, favoring bounce setups
- MVRV at -15.43%, suggesting reduced selling pressure
DOGE Technical Roadblocks and Setup Levels
Despite the strong bounce, DOGE is now stalling at $0.1647, where a descending trendline from May has consistently rejected advances. This resistance aligns with the 50-EMA, currently at $0.1593, which now flips to short-term support. A bearish candle with a long upper wick confirms that sellers are active above $0.165.
On the 2-hour chart, the MACD remains in bullish territory, but its histogram is flattening—hinting at momentum exhaustion. The bullish structure remains intact above $0.1570, yet a break below that level could pull prices back to $0.1502.
Technical Snapshot:
- Resistance: $0.1647 (trendline), $0.1713, $0.1796
- Support: $0.1593 (EMA), $0.1570, $0.1502
- MACD: Bullish but flattening momentum
- Trend: Still capped by descending resistance
DOGE Potential Scenarios: Breakout or Pullback?
If bulls manage to close above $0.1647 on strong volume, a push toward $0.1713 becomes likely, with $0.21 as the broader 61.8% Fibonacci target. A rejection, however, could see DOGE revisit $0.1570–$0.1593 for support confirmation.
For traders, the setup is binary:
- Bullish Trigger: Close above $0.1647 → Target $0.1713 then $0.21
- Cautious Buy Zone: $0.1570–$0.1593 → Watch for hammer or bullish engulfing pattern
- Bearish Risk: Break below $0.1502 opens downside to $0.142 and $0.13
Conclusion:
Dogecoin’s price action suggests a turning point. With historical demand zone support holding and on-chain metrics flashing capitulation, all eyes now turn to $0.165. If bulls flip this resistance, momentum could accelerate fast. But failure to break it keeps DOGE stuck in its broader downtrend.
- Check out our free forex signals
- Follow the top economic events on FX Leaders economic calendar
- Trade better, discover more Forex Trading Strategies
- Open a FREE Trading Account