SEI Surges 80% in Weekly Rally as Technical Indicators Signal Continued Bullish Momentum
This week, Sei (SEI) has been one of the best performers in the cryptocurrency market. At the time of writing, the token was trading at over
•
Last updated: Wednesday, June 25, 2025
Quick overview
- Sei (SEI) has surged 8% in the last 24 hours and 80% over the past week, outperforming major cryptocurrencies like Bitcoin.
- The selection of Sei Network as a finalist for Wyoming's state-backed stablecoin project has boosted investor confidence and credibility.
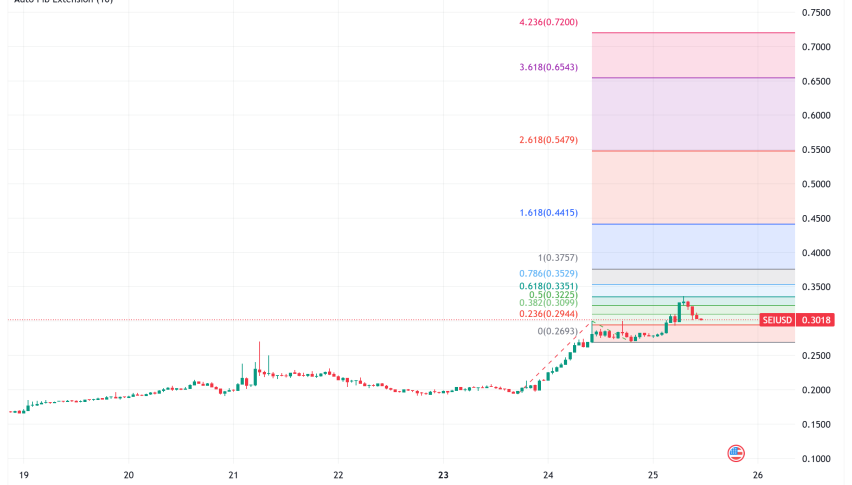
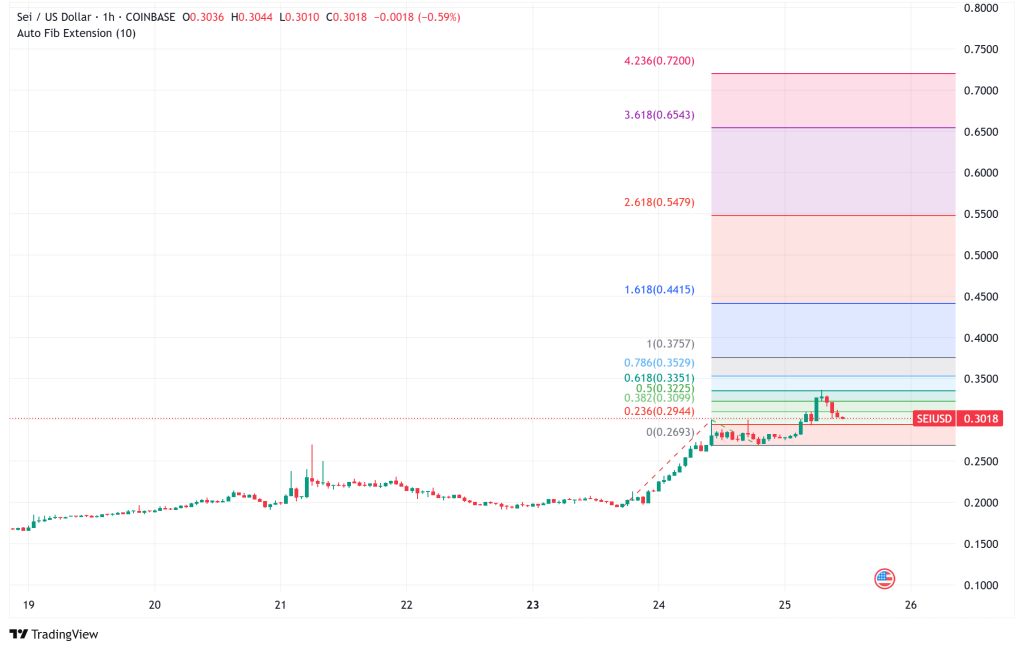
- Technical analysis indicates a bullish trend for SEI, with potential price targets of $0.34, $0.46, and $0.64 based on Fibonacci extensions.
- Despite the positive outlook, traders are monitoring key support levels, particularly the $0.2923 barrier, to gauge potential market reversals.
This week, Sei (SEI) has been one of the best performers in the cryptocurrency market. At the time of writing, the token was trading at about $0.30, which is an astounding 8% increase over the past 24 hours and an amazing 80% increase over the past seven days. SEI has been one of the best-performing cryptocurrencies on the market thanks to the meteoric rally, which has made it far better than Bitcoin and other big cryptocurrencies.
Wyoming Stablecoin Selection Boosts Fundamentals
SEI has gotten a big boost in its fundamentals when Wyoming chose Sei Network as a finalist for the first state-backed stablecoin project in the US. This extraordinary event has made investors more confident and shown that SEI is becoming more credible as an institution.
The Wyoming Stable Token Commission’s decision puts SEI in the running for this pioneering project, which could set crucial standards for state-level cryptocurrency adoption in the U.S.
This month also saw the release of two key AI integrations, which put SEI at the vanguard of the growing AI-to-AI economy. Sei is quickly becoming a major player in the decentralized finance ecosystem. Its EVM-compatible chain is presently second in active wallets.
SEI/USD Technical Breakout Signals Extended Rally
In the last few days, SEI’s price has broken through numerous important technical levels. For the first time in months, the token closed above its March high of $0.2923. According to technical analysts, this breakout has opened the door to the next significant resistance level at $0.3642, which is the close on January 14.
The Moving Average Convergence/Divergence (MACD) indicator is giving off strong bullish signs because both the MACD and signal lines are moving up above the zero line. The growing green histogram bars add to the purchase signal, which means that the upward trend is likely to continue in the near future.
The Relative Strength Index (RSI), on the other hand, has reached overbought levels at 78. This means that there is a lot of buying pressure, but it also means that there could be short-term reversals. People in the market are keeping a careful eye on these levels since overbought conditions sometimes come before consolidation periods or short-term pullbacks.
From a broader technical point of view, looking at the weekly chart shows that SEI has finished what looks like a long-term A-B-C corrective structure since its all-time high in March 2024. Waves A and C are the same length, which supports this Elliott Wave count and suggests that a fresh upward movement may be starting.
Fibonacci Targets Point to Significant Upside
Technical experts have found several price targets using Fibonacci extension levels. The closest targets are $0.34 (1.618 extension), $0.46 (2.618 extension), and maybe $0.64 (4.236 extension). These would be more than 100% higher than where they are now.
The daily chart reveals that SEI has broken out of a declining parallel channel. Seven of the past eight candles closed in green area. For technical traders, this pattern, along with the breakout from a long-standing falling wedge formation, has made the bullish case stronger.
If the current Elliott Wave count is right, analysts say that SEI is currently in a prolonged third wave, which is usually the most active and profitable part of an upward rise. Based on sub-wave analysis, the two most likely targets for this wave to finish are $0.45 and $0.63. The higher target is thought to be more plausible.
Risk Factors and Support Levels
Even though the outlook is positive, traders are keeping an eye on important support levels in case the market turns around. If SEI closes below the important $0.2923 barrier, analysts say it might drop much down into the $0.2732 support level, which is where May’s highest price was. There are now more support zones at $0.27, $0.25, and a stronger floor at $0.20.
The RSI being overbought means that some consolidation may be needed before the next step upward. However, the overall trend is still quite positive over several timeframes.
- Check out our free forex signals
- Follow the top economic events on FX Leaders economic calendar
- Trade better, discover more Forex Trading Strategies
- Open a FREE Trading Account
- Read our latest reviews on: Avatrade, Exness, HFM and XM
ABOUT THE AUTHOR
See More
Arslan Butt
Lead Markets Analyst – Multi-Asset (FX, Commodities, Crypto)
Arslan Butt serves as the Lead Commodities and Indices Analyst, bringing a wealth of expertise to the field. With an MBA in Behavioral Finance and active progress towards a Ph.D., Arslan possesses a deep understanding of market dynamics.
His professional journey includes a significant role as a senior analyst at a leading brokerage firm, complementing his extensive experience as a market analyst and day trader. Adept in educating others, Arslan has a commendable track record as an instructor and public speaker.
His incisive analyses, particularly within the realms of cryptocurrency and forex markets, are showcased across esteemed financial publications such as ForexCrunch, InsideBitcoins, and EconomyWatch, solidifying his reputation in the financial community.