ASML Holding (ASML) Shows Signs of Pullback – Is the Rally Over?

Quick overview
- ASML Holding has experienced a remarkable 206% rally over the past two years but has retraced nearly 48% from its peak, indicating a shift in investor sentiment.
- The stock rebounded approximately 43% after testing key support at the 50-month EMA and golden ratio level at $623, preserving its long-term uptrend.
- Despite the rebound, mixed momentum indicators suggest caution, with the MACD lines bearishly crossed and the RSI in neutral territory.
- ASML is currently facing potential downside risks, with a possible retest of the 50-month EMA support zone between $623 and $680.
ASML Holding (ASML) has delivered an extraordinary rally of approximately 206% over the past two years, reflecting strong investor confidence and bullish momentum. However, since peaking, the stock has entered a significant corrective phase, retracing nearly 48% from its highs over the past year — signaling a potential shift in trend dynamics and investor sentiment.
ASML Holding Rebounds Strongly from Golden Ratio Support
Following the correction that began in mid-2024, ASML Holding (ASML) retraced sharply to test a key confluence of technical support: the 50-month EMA aligned with the golden ratio level at $623. This zone held firmly, acting as a pivotal support from which the stock staged an impressive rebound of approximately 43%.
This bounce not only preserved the structural integrity of the long-term uptrend but also ensured the EMAs remained in a golden crossover configuration, reaffirming the bullish outlook on a macro time frame. Additionally, the MACD histogram has resumed an upward trajectory, indicating a recovery in momentum.
However, it is worth noting that the MACD lines remain bearishly crossed, and the RSI is currently positioned in neutral territory, suggesting that momentum remains mixed in the near term. As of this month, price action points to the onset of another corrective move, with a potential retest of the 50-month EMA support zone between $623 and $680 now in play.

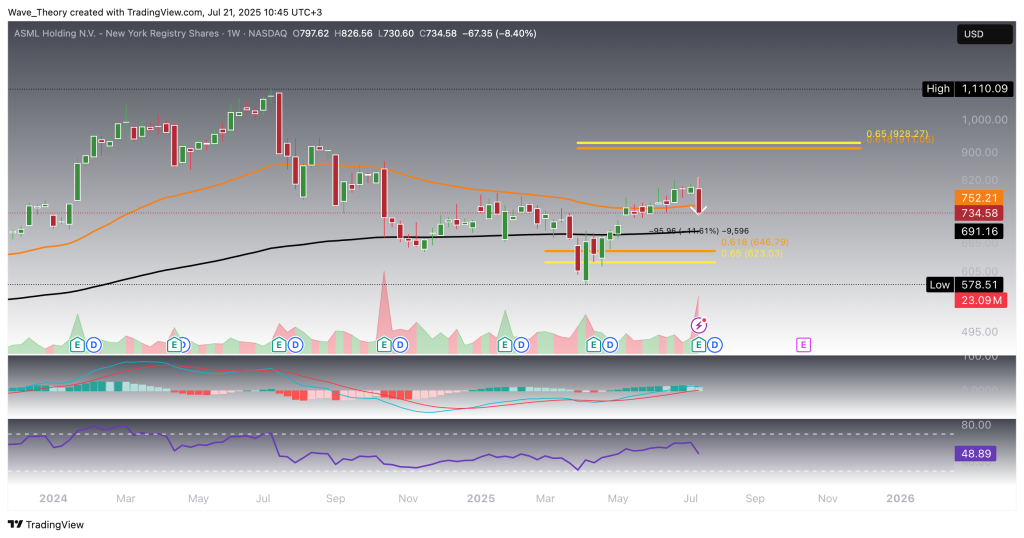
ASML Holding (ASML) Stock Rejected Below Key Golden Ratio Resistance at $925
ASML Holding (ASML) has so far failed to reach the critical golden ratio resistance at $925, despite successfully breaking above the 50-week EMA resistance at $752 in previous sessions. However, recent price action has turned notably weaker: the MACD histogram has begun to tick bearishly lower since last week, signaling waning bullish momentum. That said, both the MACD lines and EMAs remain bullishly crossed, underscoring that the broader trend has not yet fully reversed.
Meanwhile, the RSI remains in neutral territory, offering no clear directional bias. Technically, this places ASML in a vulnerable spot, especially as the stock declined by 11.6% this week alone, now threatening to close back below the 50-week EMA at $752 — a level that had previously flipped to support.
If this breakdown confirms, ASML may extend its correction toward the 200-week EMA at $691, with further downside risk toward the golden ratio support at $623, which has proven to be a historically significant level.
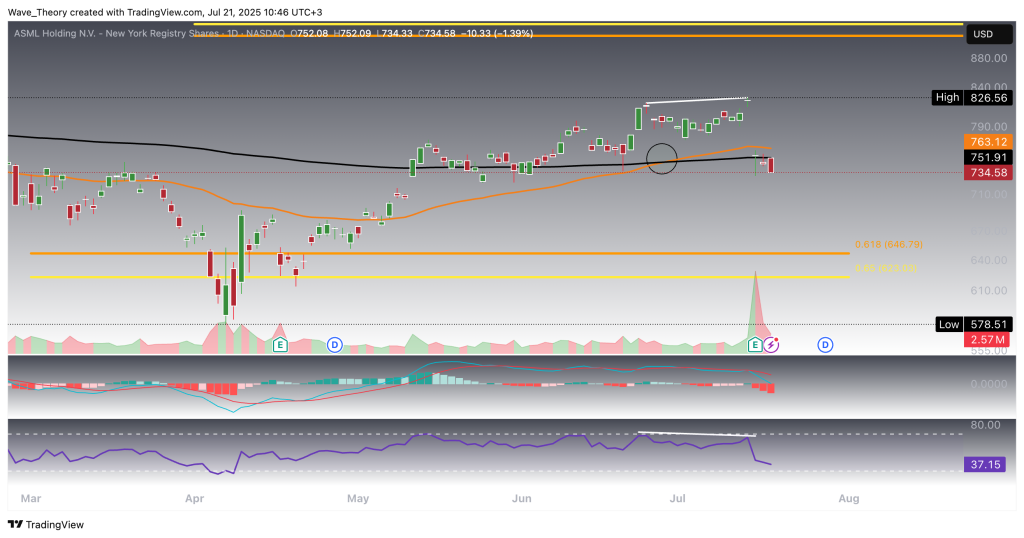
ASML Stock Shows Mixed Signals on the Daily Chart
The daily chart for ASML Holding (ASML) presents a conflicting technical landscape. On the bullish side, the EMAs have recently formed a golden crossover, signaling continued strength in the short- to medium-term trend.
However, momentum indicators point to underlying weakness. Prior to the recent 11% drop, the RSI formed a bearish divergence, often a reliable precursor to sharp corrections. Meanwhile, the MACD lines are bearishly crossed, and the MACD histogram continues to tick lower, reinforcing near-term bearish momentum.
These mixed signals suggest that while the broader structure remains intact, caution is warranted in the short term as the stock digests recent volatility.
ASML Holding (ASML) Stock: Similar Outlook on the 4H Chart
The 4-hour chart reflects a continuation of the mixed technical signals seen on higher timeframes. The RSI has formed a bearish divergence, and the MACD remains firmly in bearish territory, both pointing to sustained downside momentum in the near term.
However, the EMAs continue to hold a golden crossover formation, suggesting that the broader short-term trend remains intact for now. Given the current setup, ASML appears poised to extend its downward trajectory, yet a technical rebound may occur near key support between $623 and $691 — a zone marked by long-term Fibonacci and EMA confluence.

- Check out our free forex signals
- Follow the top economic events on FX Leaders economic calendar
- Trade better, discover more Forex Trading Strategies
- Open a FREE Trading Account
- Read our latest reviews on: Avatrade, Exness, HFM and XM