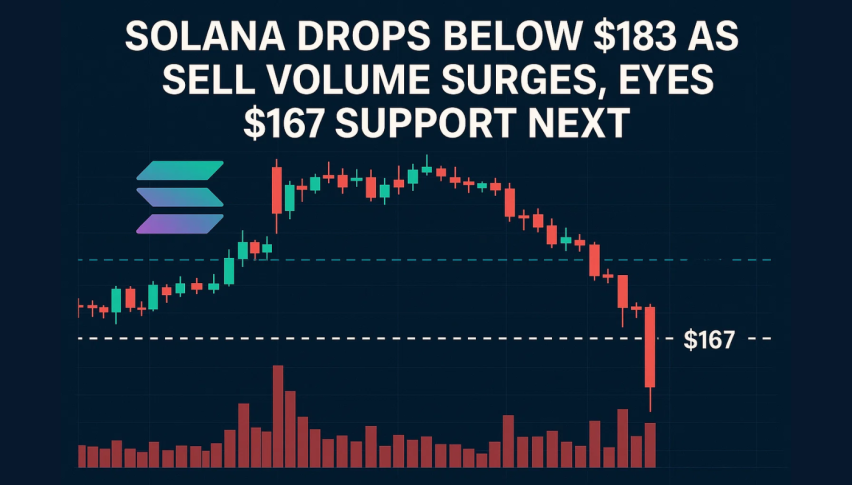
Solana Drops Below $183 as Sell Volume Surges, Eyes $167 Support Next
Solana (SOL) dropped below $183 on Tuesday and is now extending the decline after being rejected at $205.34, down 10% from last week...

Quick overview
- Solana (SOL) has dropped below $183, extending a decline after being rejected at $205.34, with a current price of $181.43.
- The 90-day Spot Taker Cumulative Volume Delta (CVD) for Solana has turned negative, indicating that selling pressure is dominating the market.
- On-chain data shows a decline in DEX trading volume on the Solana blockchain, suggesting lower liquidity and potential for increased price volatility.
- Technical indicators are signaling a bearish trend, with a critical resistance level at $184.13 that must be reclaimed for a potential recovery.
Solana (SOL) dropped below $183 on Tuesday and is now extending the decline after being rejected at $205.34, down 10% from last week. At the moment it’s at $181.43, below key support and caution is advised.
CryptoQuant data shows a big shift in sentiment as Solana’s 90-day Spot Taker Cumulative Volume Delta (CVD) turned negative last week and has been falling since. This metric measures net buy and sell volume across exchanges. A falling CVD means market sell orders are outpacing buys – selling is in control.
Adding to the bearish narrative, on-chain data from Artemis Terminal shows DEX trading volume on the Solana blockchain has been declining since early July. Lower liquidity and less traders activity often precedes more price volatility and further downside.
Key Technical Indicators Flash Warning
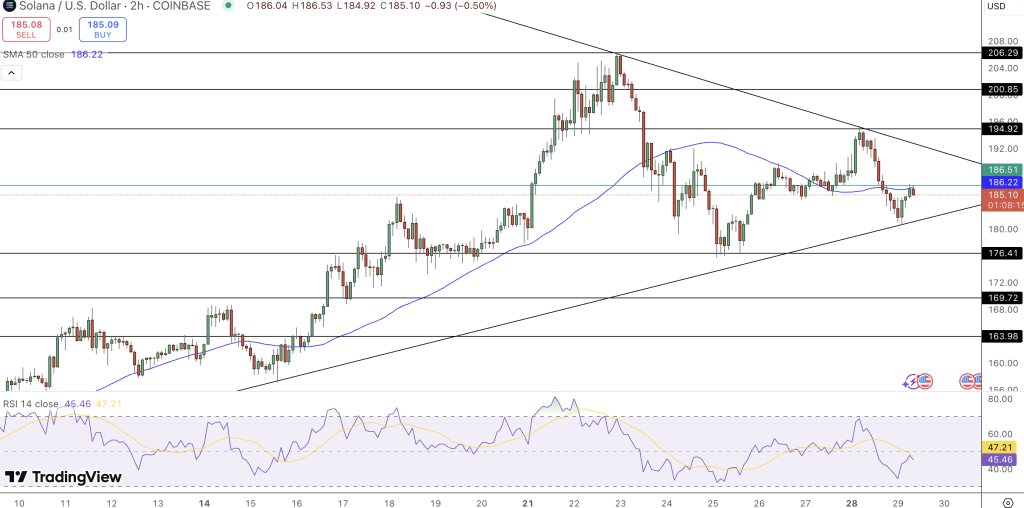
Technical analysis shows the bullish structure is weakening. Solana’s price action failed to hold above $184.13 on Monday, a level it had been consolidating for three days. Now that it’s below that level, momentum is shifting to the sellers.
Indicators to watch:
- RSI: 55 and falling, buying strength is fading
- MACD: Bearish crossover on Monday, trend is down
- 50-day EMA: Support around $167.12, next target if selling continues
Unless SOL gets back above $184.13 soon, the setup is for a deeper correction to the EMA.

What Could Reverse the Trend?
Despite the near term bearishness, Solana has upside if momentum changes. A daily close above $184.13 could start a recovery, possibly retest the February high of $205.34.
Recovery Scenario:
- Above $184.13 could attract buyers
- Next resistance: $205.34
- Positive volume and rising RSI needed to confirm the trend reversal
In the next few days, traders should watch liquidity and sentiment metrics to see if they stabilize or break down.
- Check out our free forex signals
- Follow the top economic events on FX Leaders economic calendar
- Trade better, discover more Forex Trading Strategies
- Open a FREE Trading Account
- Read our latest reviews on: Avatrade, Exness, HFM and XM


