Bitcoin Consolidates Above $118K, Markets Await Fed Decision and White House Crypto Policy
On Tuesday, Bitcoin (BTC) stayed above the important $118,000 support level. It didn't alter much in the last 24 hours, as markets began a
Quick overview
- Bitcoin remains stable above the $118,000 support level, trading within a narrow range of $117,000 to $120,000 as traders prepare for upcoming policy announcements.
- Technical analysis indicates a potential breakout for Bitcoin, with key resistance levels identified at $118,600 and support at $117,250.
- Institutional demand continues to drive long-term optimism, highlighted by MicroStrategy's recent purchase of over 21,000 BTC, increasing its total holdings significantly.
- Market sentiment may shift based on the Federal Reserve's interest rate decision and the White House's forthcoming crypto policy report, which could influence Bitcoin's price trajectory.
On Tuesday, Bitcoin BTC/USD stayed above the important $118,000 support level. It didn’t alter much in the last 24 hours, as markets began a phase of cautious stabilization before important policy pronouncements. The largest cryptocurrency in the world is still trading in a narrow band of $117,000 to $120,000. Traders are lowering their risk before the Federal Reserve’s interest rate decision on Wednesday and the White House’s highly anticipated report on crypto policy.
BTC/USD Technical Analysis Points to Imminent Breakout
Bollinger Bands Signal Range Expansion Ahead
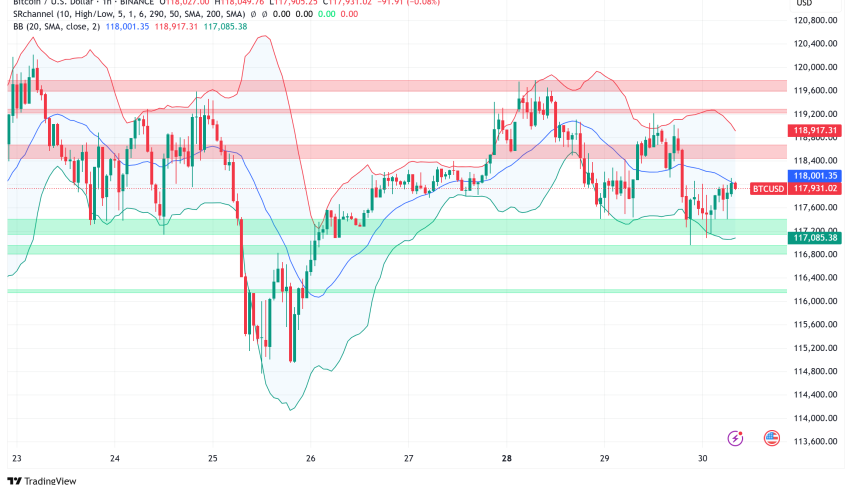
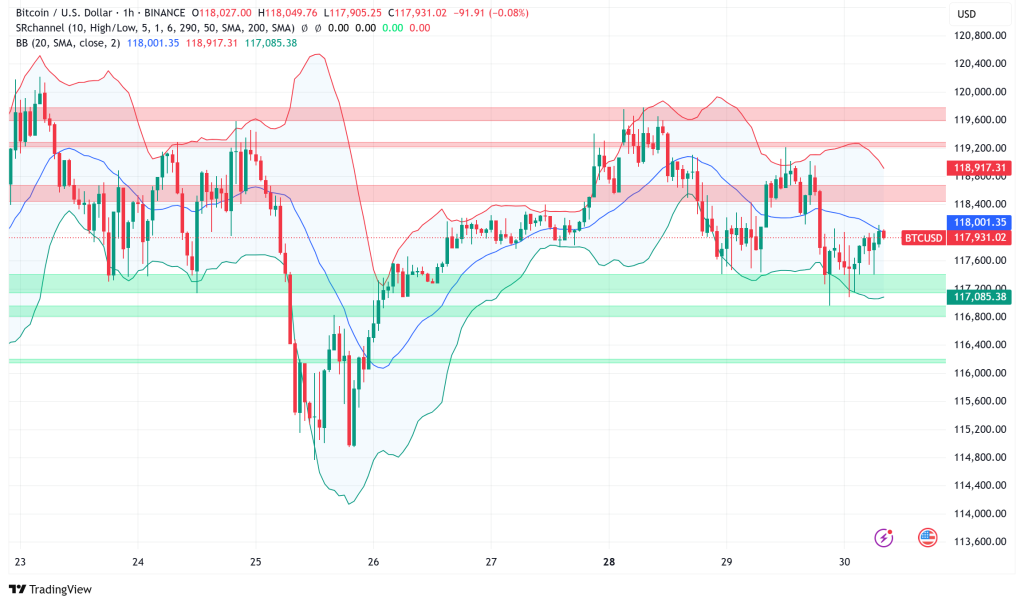
Bitcoin’s price action has been very stable over the past three weeks. The daily high-to-low range has gone from $4,200 on July 14 to roughly $2,300 now, and intraday volatility has dropped by almost 45%. The Bollinger Bands show this compression by pinching to almost close levels, which has historically meant that a directional change is about to happen.
The technical setup shows that Bitcoin is ready for a range expansion. The 100-day exponential moving average (EMA) on the four-hour chart acts as dynamic support and keeps the risk of going down low. According to market structure analysis, there isn’t much buy-side liquidity until $114,500. This means that the path of least resistance is higher toward the $120,000-$122,000 zone.
Key Resistance and Support Levels
Technical analysts have found important levels that could decide what Bitcoin does next. The hourly chart shows a bearish trend line development, which means that immediate resistance is at $118,600. If Bitcoin breaks through this level, the next goals are $119,250 and $119,800. If it breaks over, it might go as high as $122,500 and the primary aim of $123,200.
On the other hand, support is still strong at $117,250, which is the 50% Fibonacci retracement level. There are more support zones at $116,650 and $115,950, with the biggest support at $114,500 and $113,500.
Bitcoin’s Market Dynamics Show Mixed Signals
Institutional Activity Remains Strong
Even if there has been some short-term consolidation, institutional demand is still driving long-term optimistic sentiment. MicroStrategy, which is now called Strategy, made news when it bought 21,021 BTC at an average price of $117,256 per coin, the most it has bought since March. The corporation used the money from its fourth preferred stock offering (STRC) to pay for this $2.46 billion purchase. The offering raised $2.5 billion, making it the biggest US IPO of 2025.
The purchase raises Strategy’s total Bitcoin holdings to 628,791 BTC, making it the biggest corporate Bitcoin holder. Over 160 publicly traded corporations have added cryptocurrencies to their balance sheets because of the company’s ongoing accumulation strategy.
Futures Market Shows Risk Reduction
Data from the derivative market shows that traders are getting ready for the Fed’s announcement. During Tuesday’s trading session, the total open interest in Bitcoin fell from $50.58 billion to $49.58 billion. Long liquidations made the selling pressure worse. In the last 12 hours, $173.8 million in long positions were margin-called, which added to the current price drop.
The structure of the futures market shows that open interest is high at $45.6 billion. However, the fact that long-side funding is rising signals that leveraged traders are becoming more confident. If Bitcoin goes above $121,600, liquidation data shows that about $2 billion in short holdings might be squeezed.
Potential Catalysts for Wednesday’s Session
Federal Reserve Decision Impact
The Federal Open Market Committee (FOMC) meeting on Wednesday is getting a lot of attention from the market. CME Group’s FedWatch tool shows that there is a 98% chance that rates will stay in the 4.25%-4.5% range. Even though a rate cut isn’t likely, any dovish comments from Fed Chair Jerome Powell could change how people feel about the market a lot.
President Trump’s calls for fast rate cuts are putting more and more pressure on the Fed. However, Powell seems to be sticking to his guns on making policy decisions based on evidence. A neutral result that fits with what the market expects, along with good news from the White House, could be what pushes Bitcoin to its next all-time high.
White House Crypto Policy Report
The imminent release of the White House’s strategic crypto policy study may be more important for Bitcoin’s future. It is expected that this document will show how many Bitcoins the US government presently has and possibly suggest measures toward creating an official strategic Bitcoin reserve under the Trump administration.
The paper could suggest a Bitcoin Reserve Framework and delta-neutral accumulation strategies. This could lead to more spot ETF flows and more companies building up their treasuries. These kinds of changes could overcome short-term technical problems and push Bitcoin to new all-time highs.
Bitcoin Price Prediction and Outlook
Bitcoin looks like it will move up toward $122,000 in the near future, where a lot of short liquidations are happening, based on current technical analysis and market conditions. But seasonal considerations could make things worse. Historically, August has had negative returns in more than 60% of cases, with an average return of only 2.56%.
Some on-chain measures are showing signs of cooling down. For example, spot Bitcoin ETF flows fell 80% week over week to $496 million from $2.5 billion, while daily trading volumes fell to $8.6 billion. The Relative Strength Index (RSI) has gone down from 74.4 to 51.7, which could mean that the spot market is getting tired.
If things go well on Wednesday, with a neutral Fed policy and good news from the White House, Bitcoin might break over the $123,200 resistance zone and make new highs. On the other hand, some analysts have said that if current support levels are not kept up, the $114,000-$110,000 zone could be tested again.
- Check out our free forex signals
- Follow the top economic events on FX Leaders economic calendar
- Trade better, discover more Forex Trading Strategies
- Open a FREE Trading Account
- Read our latest reviews on: Avatrade, Exness, HFM and XM