Solana Tests $200 as DeFi Development Corp’s $250M Treasury Fuels Institutional Momentum
Solana (SOL) has shown amazing strength, rising 12% in the last 24 hours to stay above $196, as institutional adoption speeds up through
Quick overview
- Solana has surged 12% in the last 24 hours, driven by institutional adoption and significant purchases by DeFi Development Corp.
- DeFi Development Corp's treasury now holds over 1.3 million SOL tokens, valued at nearly $250 million, contributing to the price rally.
- Technical analysis indicates bullish momentum for SOL, with key resistance levels at $200 and $205, and potential upside targets near $250.
- The combination of institutional interest, strong technical indicators, and ecosystem growth suggests further price increases for Solana.
Solana SOL/USD has shown amazing strength, rising 12% in the last 24 hours to stay above $196, as institutional adoption speeds up through smart corporate treasury allocations. DeFi Development Corp’s aggressive strategy for buying Solana has greatly helped the rally. Their treasury now has more than 1.3 million SOL tokens, which are worth almost $250 million.
Joseph Onorati, the CEO of DeFi Development Corp, said that the company’s SOL Per Share measure has gone up by more than 47% since June. This shows that their validator operations and staking plan are working well. The company makes over $63,000 a day in SOL-denominated revenue via network participation. This shows that Solana has a higher potential for productive yield than non-staking assets like Bitcoin.
Cantor Fitzgerald managed the company’s recent $122.5 million convertible loan issue, which directly improved their Solana treasury position. In the first two weeks of August alone, they bought more than 4,500 SOL tokens. This institutional commitment, together with their 10% Annualized Organic Yield (AOY) from validator operations, shows that more and more businesses are interested in Solana’s staking ecosystem.
SOL/USD Technical Analysis Points to Bullish Continuation Pattern
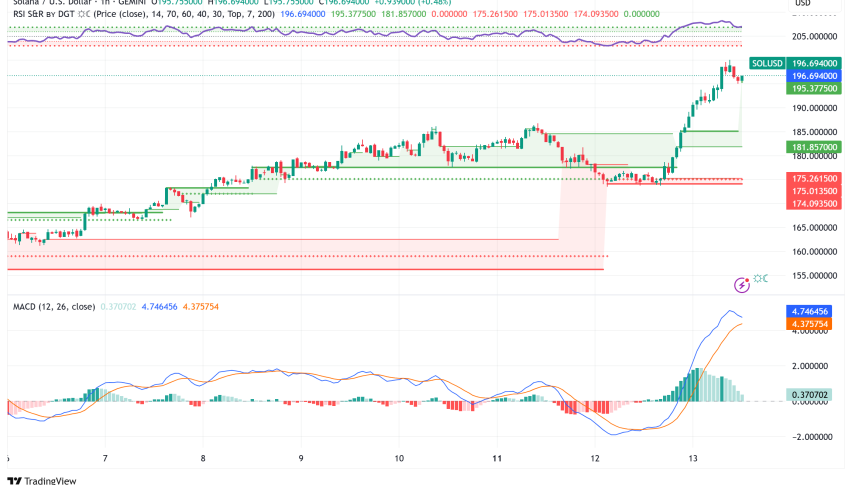
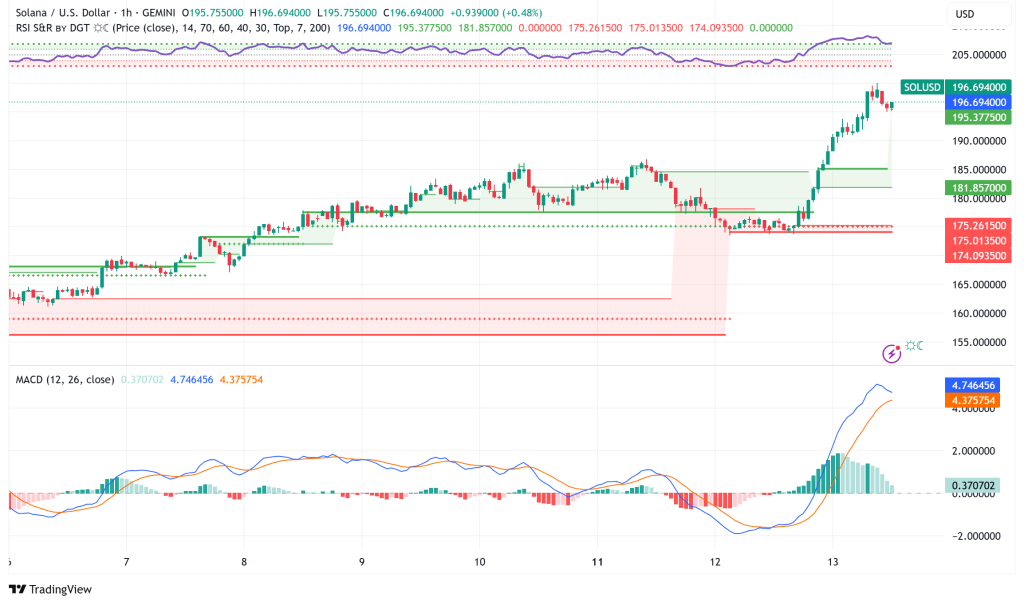
From a technical point of view, SOL has gained a lot of momentum after breaking out of the $175 support zone. The cryptocurrency broke through important resistance levels between $185 and $190. The bulls then pushed the price past the important $195 level, where it reached a high of $199.
The hourly chart shows that the price has broken above a negative trend line with resistance around $178. The price is currently comfortably above the 100-hourly simple moving average at $192. Technical indicators are showing optimistic signs, with the MACD picking up speed in the bullish zone and the RSI staying above 50, which means that the upward momentum is likely to continue.
The current price action shows that SOL is holding above the 23.6% Fibonacci retracement level of the upward rise from the $173 swing low to the $199 high. This means that people are taking profits and adjusting their positions instead of a negative reversal.
Critical Resistance Levels and Price Targets
The first level of resistance is at $200, and the next big one is at $202–$205. If the price closes above the $205 resistance level, it might go up again toward $212, with longer-term targets nearing $220.
Advanced technical analysis shows that SOL is making a rising wedge pattern, which usually means that the price will go down. But if the cryptocurrency can break over the current resistance levels with a lot of volume, it looks like a short-term surge to $220 is on the way. The price is above the Ichimoku cloud, and levels are getting close to a bullish crossing, which supports the favorable outlook even more.
The Chaikin Money Flow (CMF) indicator has bounced back dramatically above zero after falling since early August. This means that money is flowing back onto the platform and institutions are buying more.
Solana Price Prediction and Risk Assessment
SOL looks like it could go up 20% from where it is now, based on its existing technological framework and basic developments. The next upside goal is about $244–$250, which is the monthly high prediction. This is if momentum stays above $200 and breaches the $220 supply zone with significant volume.
The 50% Fibonacci retracement level adds more safety on the downside, while the key support levels are still at $194 and $186. If the price drops below $186, it could test the $180 support zone again. If it closes below $175, the present bullish thesis would be wrong.
The combination of institutional acceptance through DeFi Development Corp’s treasury strategy, strong technical momentum, and expanding ecosystem engagement in NFTs and meme tokens makes a strong argument for more upside. Traders should keep a close eye on the $219–$222 resistance zone, though. If the price breaks above this level and stays there, it will likely confirm the way to $250 and maybe even $268 in a long-term rise.
- Check out our free forex signals
- Follow the top economic events on FX Leaders economic calendar
- Trade better, discover more Forex Trading Strategies
- Open a FREE Trading Account
- Read our latest reviews on: Avatrade, Exness, HFM and XM
Related Articles

Sidebar rates
Related Posts
