Bitcoin Faces Critical Juncture, Six-Week Rally Enters Potential Correction Zone
Bitcoin (BTC) is currently worth more than $115,000, but it has dropped 1.7% in the last 24 hours. Analysts think this could be a key point
Quick overview
- Bitcoin's price has dropped 1.7% in the last 24 hours, currently valued at over $115,000 after reaching an all-time high of $124,500.
- Analysts suggest that Bitcoin may be nearing a significant corrective phase, with historical patterns indicating potential downturns around the seventh week of its current uptrend.
- Technical analysis reveals critical support levels at $117,500 and $114,500, which could influence Bitcoin's near-term direction.
- Despite short-term bearish signals, some analysts remain optimistic about a potential rally in Q4, suggesting that current weaknesses could lead to significant growth by the year's end.
Bitcoin BTC/USD is currently worth more than $115,000, but it has dropped 1.7% in the last 24 hours. Analysts think this could be a key turning point in the cryptocurrency’s recent bull run. After six weeks of advances that sent BTC to a new all-time high of $124,500, a number of technical indicators and historical trends imply that the market may be getting close to its next big corrective period.
Historical Patterns Point to Imminent BTC Price Discovery Correction
Rekt Capital, a well-known trader, said that Bitcoin is now in the seventh week of its second “price discovery uptrend” since the halving event in 2024. Historical data shows that Bitcoin’s second uptrend usually ends between weeks five and seven. This makes the timing of the present trend very important.
“Historically, Bitcoin Price Discovery Uptrend 1 tends to end between Week 6 and 8 of its uptrend.” “Price Discovery Uptrend 2” shows that Bitcoin usually terminates its uptrend between Week 5 and 7. Rekt Capital pointed out that in both the 2013 and 2025 cycles, corrections started around Week 7.
The first corrective phase of 2025 already showed how bad these pullbacks were. Bitcoin fell from around $110,000 to less than $75,000, which is almost a 30% drop that is in line with what has happened in past halving cycles.
Wave Analysis Suggests Deeper Correction Ahead
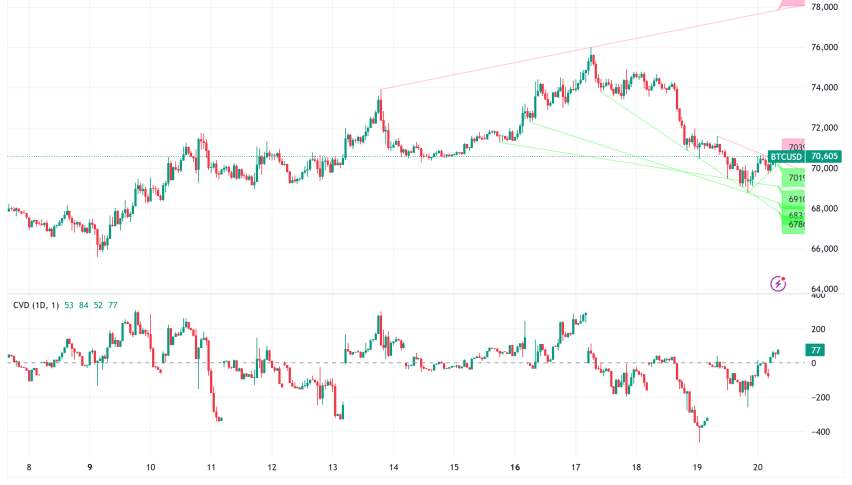
Crypto analyst CasiTrades has drawn up a possible ABC corrective structure that might cause Bitcoin to drop a lot from where it is now, which adds to the negative mood. The study shows a five-wave corrective pattern with an initial goal of $77,000, which is the macro 0.382 Fibonacci retracement level.
The suggested wave structure has:
- Wave 1: The first drop to $112,000
- Wave 2: A short comeback to $120,000
- Wave 3: a bigger drop to the $89,000 area
- Wave 4: Test the break of $100,000 again
- Wave 5: The lowest point is $77,000.
If this bearish scenario comes true, the macro correction goal goes up to $60,000, which is the golden 0.618 Fibonacci retracement level.
Exchange Data Reveals Bitcoin Distribution Patterns
According to CryptoQuant’s on-chain analysis, there is more selling pressure, especially on Binance, which is the biggest cryptocurrency exchange in the world. BorisVest, an analyst, said that Bitcoin’s netflows have become positive and outflows have gone down, which means the market is entering a distribution phase.
“The missing piece was buyers; once the price hit its peak and demand picked up, selling pressure sped up,” BorisVest said. This shows how exchange reserves kept climbing even as Bitcoin hit new all-time highs, which means that significant holders were taking profits.
This distribution pattern, along with the Perpetual-Spot Price Gap showing a lot of enthusiastic buyers, made the perfect conditions for whale distribution operations that may last for one to two weeks.
Critical Support Levels Define Near-Term Outlook
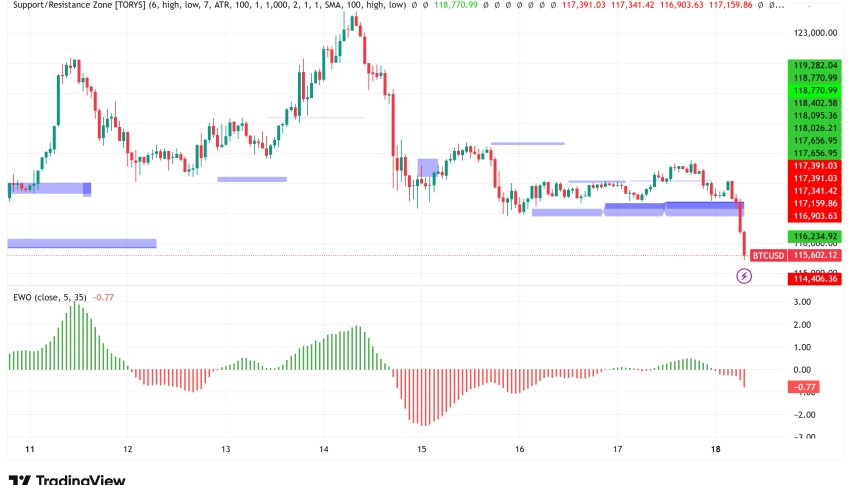
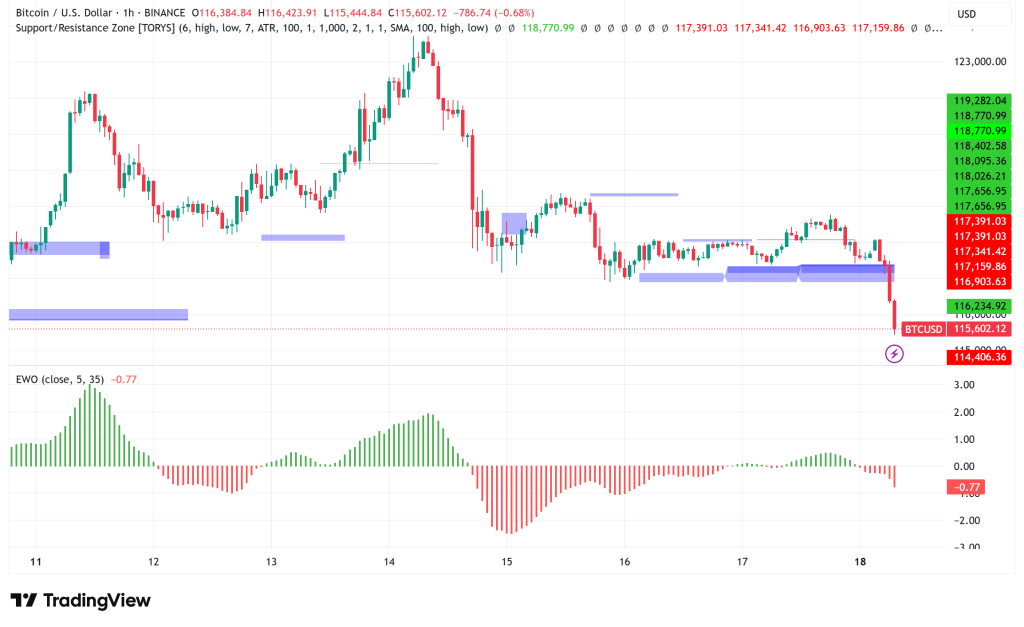
Technical analysis has found two important support zones that will affect the short-term direction of Bitcoin. According to cost-basis distribution statistics from Glassnode, there are a lot of investors that have positions around the $117,500 and $114,500 levels.
Around the $117,500 level, almost 72,900 BTC were bought, while around the $114,500 level, 56,201 BTC were bought. These price levels could be very helpful since investors who are making money may protect these levels by buying more.
But if the price drops below $114,500, it might start a further downturn because there don’t seem to be any strong support levels below this important level.
Q4 Rally Still Possible Despite Near-Term Weakness
Even while the short-term outlook is negative, several analysts are still hopeful for a solid fourth quarter. Trader Daan Crypto Trades said that Bitcoin hasn’t had two “green” months in a row in August and September, which might mean that seasonal tendencies could help a rally at the conclusion of the year.
The analysis said, “Any bigger flushes in the next 1–2 months would be welcome and could very well be the last bigger dip for the Q4 end of the year rally.” This means that the current weakness could lead to explosive growth toward the end of the year.
According to historical statistics from CoinGlass, BTC gained 2.1% in August, which is already more than the 1.8% historical average. September usually sees a 3.8% drop, though.
Bitcoin Price Prediction and Market Outlook
Bitcoin looks like it’s going to have a big correction in the next few weeks based on a combination of technical indications, historical trends, and on-chain data. The most likely thing to happen is:
In the next week or two, there will be more selling pressure, with the first support tests between $117,500 and $114,500.
In the medium term (1–2 months): If wave analysis is correct, there might be a correction to the $89,000-$77,000 level.
Long-term (Q4 2025): The bull trend might start up again, with aims perhaps reaching $150,000 to $160,000.
- Check out our free forex signals
- Follow the top economic events on FX Leaders economic calendar
- Trade better, discover more Forex Trading Strategies
- Open a FREE Trading Account
- Read our latest reviews on: Avatrade, Exness, HFM and XM
Related Articles
Sidebar rates
Related Posts
