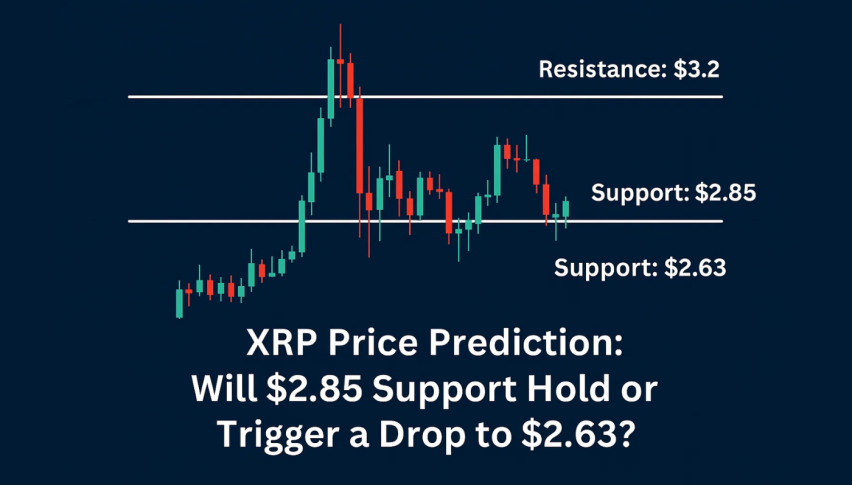
XRP Price Prediction: Will $2.85 Support Hold or Trigger a Drop to $2.63?
XRP dropped 6% on Tuesday as large holders sold ahead of Powell’s speech at Jackson Hole. Over the last 6 days it’s down 13%.
Quick overview
- XRP dropped 6% on Tuesday and is down 13% over the last six days as large holders sold off ahead of Powell's speech.
- Despite the recent decline, 93% of XRP's supply remains profitable, but profit-taking could increase if interest rates rise.
- Technical indicators show XRP is in a bearish trend, with critical support at $2.85 and resistance between $3.02 and $3.15.
- Traders are advised to consider a channel breakout strategy, focusing on discipline and confirmation in their trades.
XRP dropped 6% on Tuesday as large holders sold ahead of Powell’s speech at Jackson Hole. Over the last 6 days it’s down 13%. Investors are getting cautious.
Blockchain data shows wallets with 10-100 million XRP sold 460 million last week. Mid-sized wallets with 1-10 million XRP added 130 million. Mixed sentiment. Some are taking profits, others are building for a bounce.
High Profit Margins Mean Selloff Risk
Despite the drop, XRP is still one of the most profitable crypto assets. 93% of the supply has been in profit since mid-July and margins are still above 90%. Margins haven’t been below 80% since November when the token surged after Trump’s election.
Ripple’s win against the SEC and positive policy signals from Washington have fueled the rally. But with those catalysts priced in, profit taking could intensify if Powell signals a rate hike and a broader risk off move.
XRP Technicals Turn Bearish
The selloff pushed XRP below the $2.95 zone, below the lower bound of the symmetrical triangle and below the 50 day SMA. If it can’t get back above these levels it’s open to further downside.
XRP is currently at $2.89, inside the descending channel and hugging the $2.85 support. Repeated long lower shadows suggest dip buyers are present but conviction is thin. Three black crows indicates sustained bearish momentum.
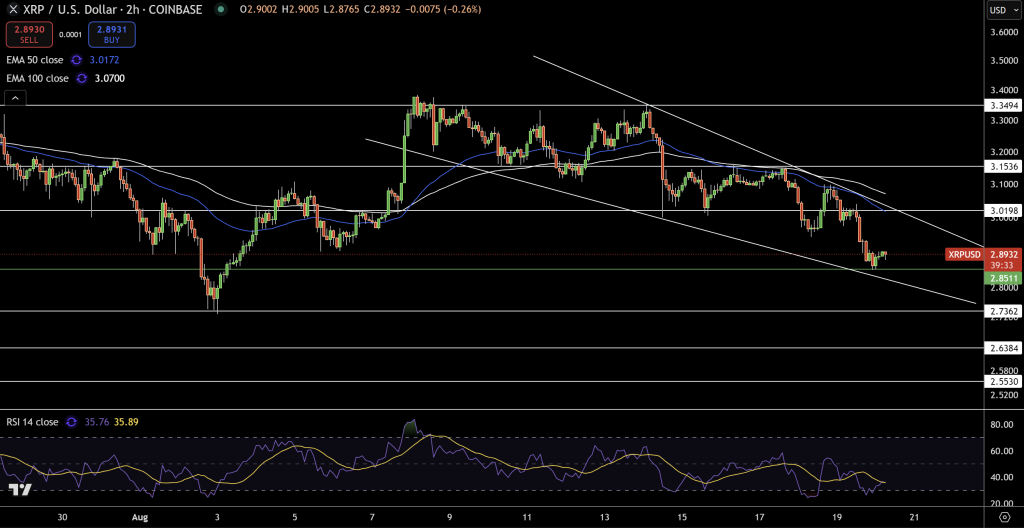
Momentum indicators are overbought. RSI at 35.8 is flirting with oversold, could be bullish divergence. Stochastic Oscillator confirms sellers. But oversold conditions means there’s a chance of a short term bounce.
The channel is clear. Resistance is $3.02-$3.15, support is $2.85, then $2.74 and $2.63. Above the channel and it’s a relief rally. Below $2.85 and it’s a slide to $2.74.
XRP Trade Idea
For beginners this is a channel breakout trade. A speculative long at $2.85 with stops at $2.82 to $3.02 then $3.15 if it momentum’s. Or a breakdown below $2.85 to short to $2.74. In this trade discipline is key—confirmation is more important than calling the turn.
- Check out our free forex signals
- Follow the top economic events on FX Leaders economic calendar
- Trade better, discover more Forex Trading Strategies
- Open a FREE Trading Account
- Read our latest reviews on: Avatrade, Exness, HFM and XM
Related Articles

Sidebar rates
Related Posts
